Building a Property Graph Pipeline from the TEG Benchmark: Part 2 – Populating the AWS Neptune Graph

Introduction
Part 1 of this series addressed the first two stages of the pipeline: acquiring the TEG-DB [1] datasets from HuggingFace and converting their PyTorch Geometric serialization format into Neptune-compatible CSV files, a process that required navigating several undocumented inconsistencies in the PKL structure across datasets. This installment, Part 2, turns to the bulk loading approach, which proved more reliable for datasets at TEG-DB scale. What follows covers the complete operational path from staging CSV files in S3 through the Neptune Bulk Loader API, establishing a connection from gdotv via IAM authentication, and running Gremlin queries against the loaded graph to verify structural integrity and showcase the edge text that is the benchmark’s central contribution.
Ingesting TEG Datasets into Amazon Neptune
Public Connectivity and IAM Authentication
Amazon Neptune can be configured with a publicly accessible endpoint which is an opt-in cluster setting that exposes Neptune’s port 8182 directly on the internet while simultaneously enforcing IAM authentication on every request. When public connectivity is enabled, Neptune rejects all unsigned requests at the network layer and requires each client to present a valid AWS SigV4 signature alongside its HTTP call. This arrangement makes an EC2 bastion unnecessary: the local machine communicates with Neptune directly, provided it holds valid AWS credentials and can reach the cluster’s public DNS name.
Two prerequisites must be in place before proceeding. First, the Neptune cluster must be launched (or updated) with the “Publicly accessible” option enabled in the console or the --publicly-accessible flag in the CLI. Second, the IAM identity issuing the load requests must carry a policy that permits the neptune-db:StartLoaderJob and neptune-db:GetLoaderJobStatus actions against the cluster’s resource ARN. Neptune’s IAM integration is distinct from its database-level authentication settings; both must be active simultaneously for a publicly accessible cluster. If you don’t yet have a cluster running, the Neptune setup walkthrough covers cluster creation and IAM configuration from scratch.
The import path for the TEG data otherwise follows the same two-stage route as a private cluster. The CSV files produced by the Part 1 conversion pipeline (one vertex file and one edge file per dataset) must first be staged in an S3 bucket from which Neptune has read permission via a pre-attached IAM role. Neptune then pulls from S3 during the bulk load. The only difference from a private cluster is that the HTTP commands controlling that load are issued from the local machine rather than from an EC2 bastion.
All data-plane operations against a publicly accessible Neptune cluster (loading, monitoring, and querying) can be performed using the aws neptunedata subcommand, which handles SigV4 signing automatically and respects the standard --profile flag. Every command takes an --endpoint-url flag pointing at the cluster’s public hostname on port 8182, which is how the CLI locates the specific cluster without requiring a VPC-internal network path.
Verifying Neptune Is Reachable
Before issuing a bulk load request, it is worth confirming that the Neptune cluster is reachable and in a healthy state. A signed GET request to the /status endpoint, exposed on port 8182 over HTTPS, returns a JSON object whose status field should read "healthy" for a correctly configured cluster:
aws neptunedata get-engine-status \
  --endpoint-url https://<NEPTUNE_ENDPOINT>:8182 \
  --profile <YOUR_PROFILE>
A healthy response includes the engine version and the role of the queried instance within the cluster. A timeout at this stage most commonly indicates that the cluster’s security group does not permit inbound traffic on port 8182 from the calling IP address; an AccessDeniedException indicates that the IAM policy is missing the required neptune-db:GetEngineStatus permission. Either case requires administrator attention before the load can proceed.
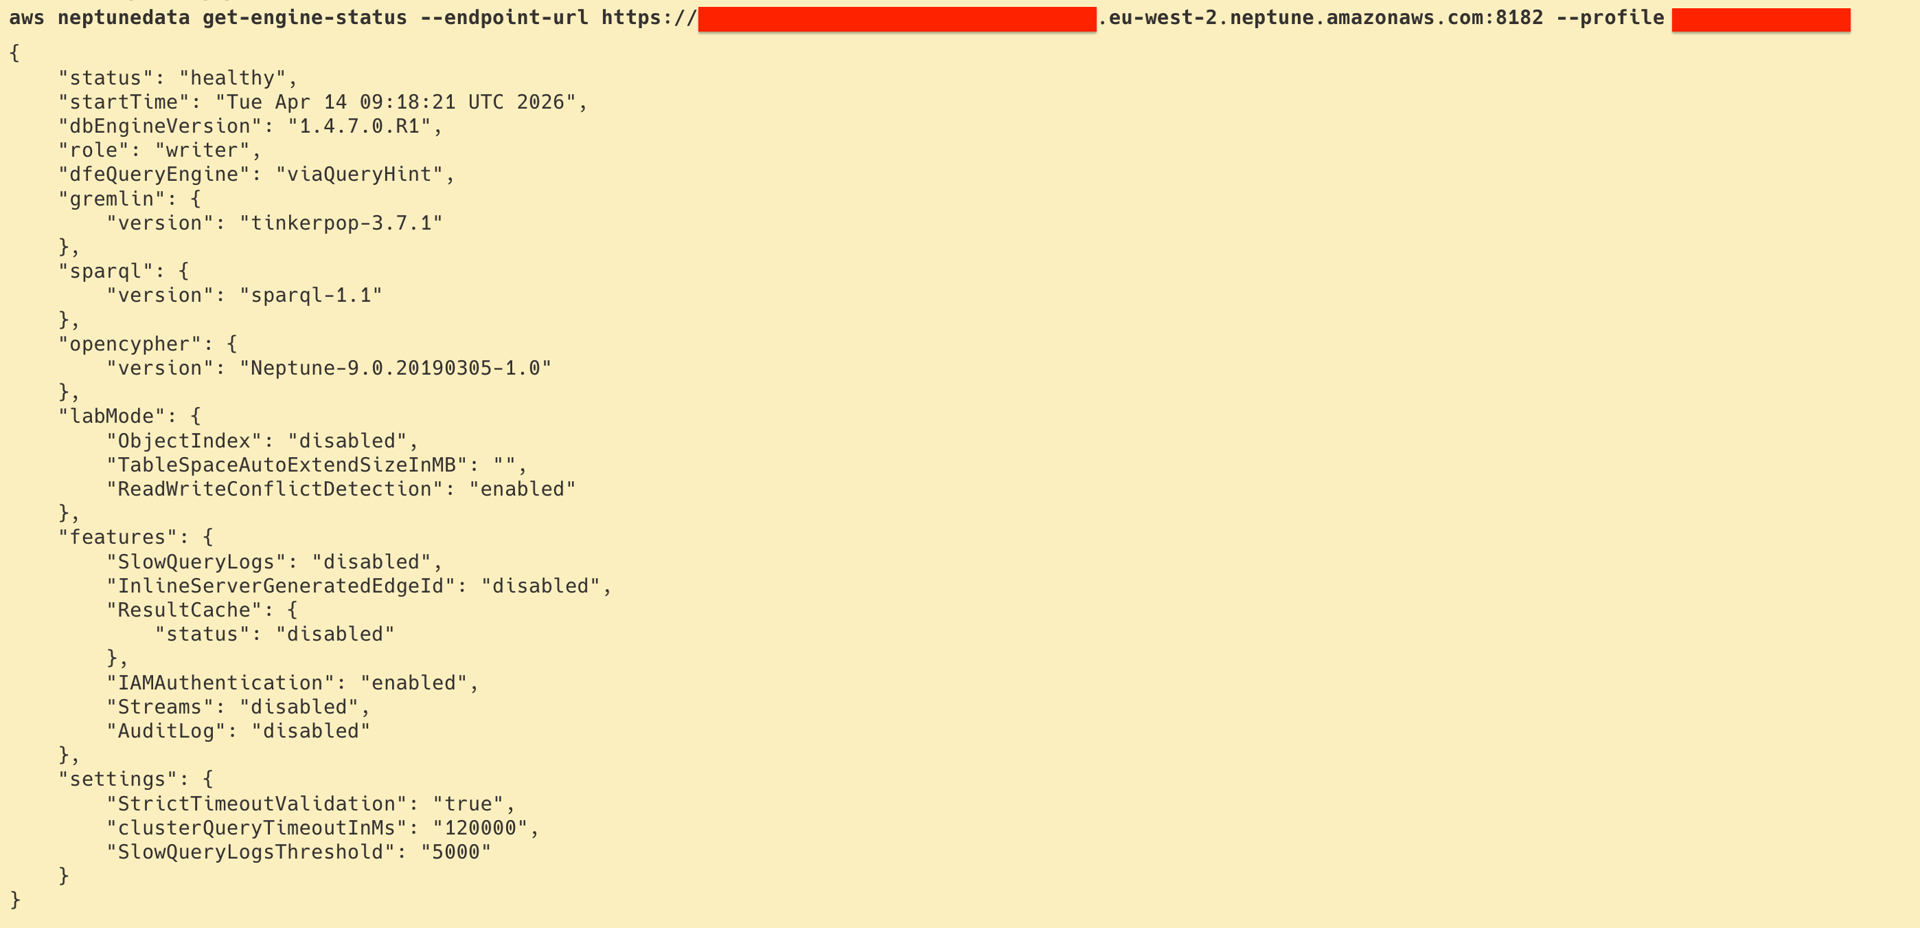
A healthy Neptune cluster status response from aws neptunedata get-engine-status, confirming the cluster is reachable and IAM authentication is working before triggering the bulk load.
Triggering the Bulk Load
Neptune’s bulk load is triggered with the start-loader-job subcommand of aws neptunedata. The command specifies the S3 source path, the CSV format, the IAM role Neptune should use to authenticate with S3, and several operational parameters. For the TEG-DB datasets, a representative load request takes the following form, issued from the local machine:
aws neptunedata start-loader-job \
  --endpoint-url https://<NEPTUNE_ENDPOINT>:8182 \
  --source "s3://<YOUR_BUCKET>/datasets/<YOUR_FOLDER>/" \
  --format "csv" \
  --iam-role-arn "arn:aws:iam::<ACCOUNT_ID>:role/NeptuneLoadFromS3" \
  --s3-bucket-region eu-west-2 \
  --no-fail-on-error \
  --parallelism MEDIUM \
  --queue-request \
  --profile <YOUR_PROFILE>
Several parameter choices deserve comment. Neptune loads all CSV files found within the specified S3 folder in a single job, inferring vertex files from those whose headers contain ~id and ~label, and edge files from those whose headers additionally contain ~from and ~to, following the Gremlin CSV bulk load format. This means that placing one vertex CSV and one edge CSV in a dedicated folder per dataset (the structure produced by the Part 1 pipeline) is both the simplest and the safest staging layout.
Setting failOnError to FALSE instructs Neptune to skip malformed rows rather than aborting the entire load. This is appropriate for an exploratory pipeline where a small number of edge text encoding anomalies (unescaped commas, embedded newlines, or overlong text fields) should not block the ingestion of several hundred thousand well-formed records. The parallelism setting of MEDIUM represents a balance between load throughput and cluster stability for a shared instance; dedicated clusters can safely use HIGH or OVERSUBSCRIBE. The queueRequest flag permits multiple dataset loads to be submitted in sequence without waiting for each to complete, which is useful when loading all ten TEG-DB datasets as a batch.
The API responds synchronously with a loadId that uniquely identifies the submitted job:
{
  "status": "200 OK",
  "payload": {
    "loadId": "xxxxxxxx-xxxx-xxxx-xxxx-xxxxxxxxxxxx"
  }
}
This identifier is required for all subsequent status and error queries and should be preserved for the duration of the monitoring phase.
Monitoring the Load Job
Neptune processes the bulk load asynchronously. Progress is tracked by polling with get-loader-job-status using the loadId returned above:
aws neptunedata get-loader-job-status \
  --endpoint-url https://<NEPTUNE_ENDPOINT>:8182 \
  --load-id <LOAD_ID> \
  --profile <YOUR_PROFILE>
The overallStatus.status field transitions from LOAD_IN_PROGRESS to LOAD_COMPLETED on success, or LOAD_FAILED if a structural problem prevents completion. The fields overallStatus.parsingErrors and overallStatus.insertErrors should remain zero for a well-formed dataset; non-zero values indicate either malformed CSV headers or duplicate vertex and edge identifiers. For the TEG-DB datasets, the most common source of parsing errors is edge text that contains unescaped commas or literal newline characters, both of which the Part 1 pipeline addresses by quoting all text fields. A convenient monitoring loop that polls every thirty seconds can be constructed with the watch utility:
watch -n 30 'aws neptunedata get-loader-job-status \
  --endpoint-url https://<NEPTUNE_ENDPOINT>:8182 \
  --load-id <LOAD_ID> \
  --profile <YOUR_PROFILE>'
The feedCount field in the response indicates how many files within the S3 folder have completed loading versus how many remain in progress, which is useful for tracking the relative sizes of the vertex and edge files when their row counts differ substantially.
Verifying the Loaded Data
Once LOAD_COMPLETED is confirmed, a pair of Gremlin count queries provides a basic sanity check against the expected vertex and edge counts from the Part 1 validation report:
aws neptunedata execute-gremlin-query \
  --endpoint-url https://<NEPTUNE_ENDPOINT>:8182 \
  --gremlin-query "g.V().count()" \
  --profile <YOUR_PROFILE>
aws neptunedata execute-gremlin-query \
  --endpoint-url https://<NEPTUNE_ENDPOINT>:8182 \
  --gremlin-query "g.E().count()" \
  --profile <YOUR_PROFILE>
If the returned counts match the CSV row counts from the Part 1 pipeline, the bulk load is complete and the graph is ready for exploration. Discrepancies in the edge count, which is more commonly affected than the vertex count, most often indicate that some edge rows referenced a ~from or ~to vertex identifier that was not present in the vertex file, causing Neptune to silently discard those edges. This is a consistency check worth running explicitly before proceeding to query authorship.
Connecting gdotv to Neptune
gdotv natively supports IAM authentication for Neptune, eliminating the need for any proxy layer. When creating a new connection, set the database hostname to the cluster’s Gremlin WebSocket endpoint on port 8182:
wss://<NEPTUNE_ENDPOINT>
gdotv offers two ways to supply IAM credentials.
The first is to use an AWS CLI profile. This requires an active SSO session, initiated with aws sso login --profile <YOUR_PROFILE> beforehand. Once logged in, the temporary credentials can be extracted and entered into gdotv’s connection settings:
aws configure export-credentials --profile <YOUR_PROFILE> --format json
The second is to provide static credentials directly: the AWS Access Key ID, AWS Secret Access Key, and AWS region are entered in the connection settings, along with either an IAM role ARN (which gdotv will assume at connection time) or a session token for temporary credential sets.
For environments where a direct connection is not possible (such as a Neptune cluster that remains VPC-private) gdotv also supports connecting through a localhost tunnel or proxy. In that case the hostname is set to localhost:8182 and IAM signing is handled by the proxy rather than by gdotv.
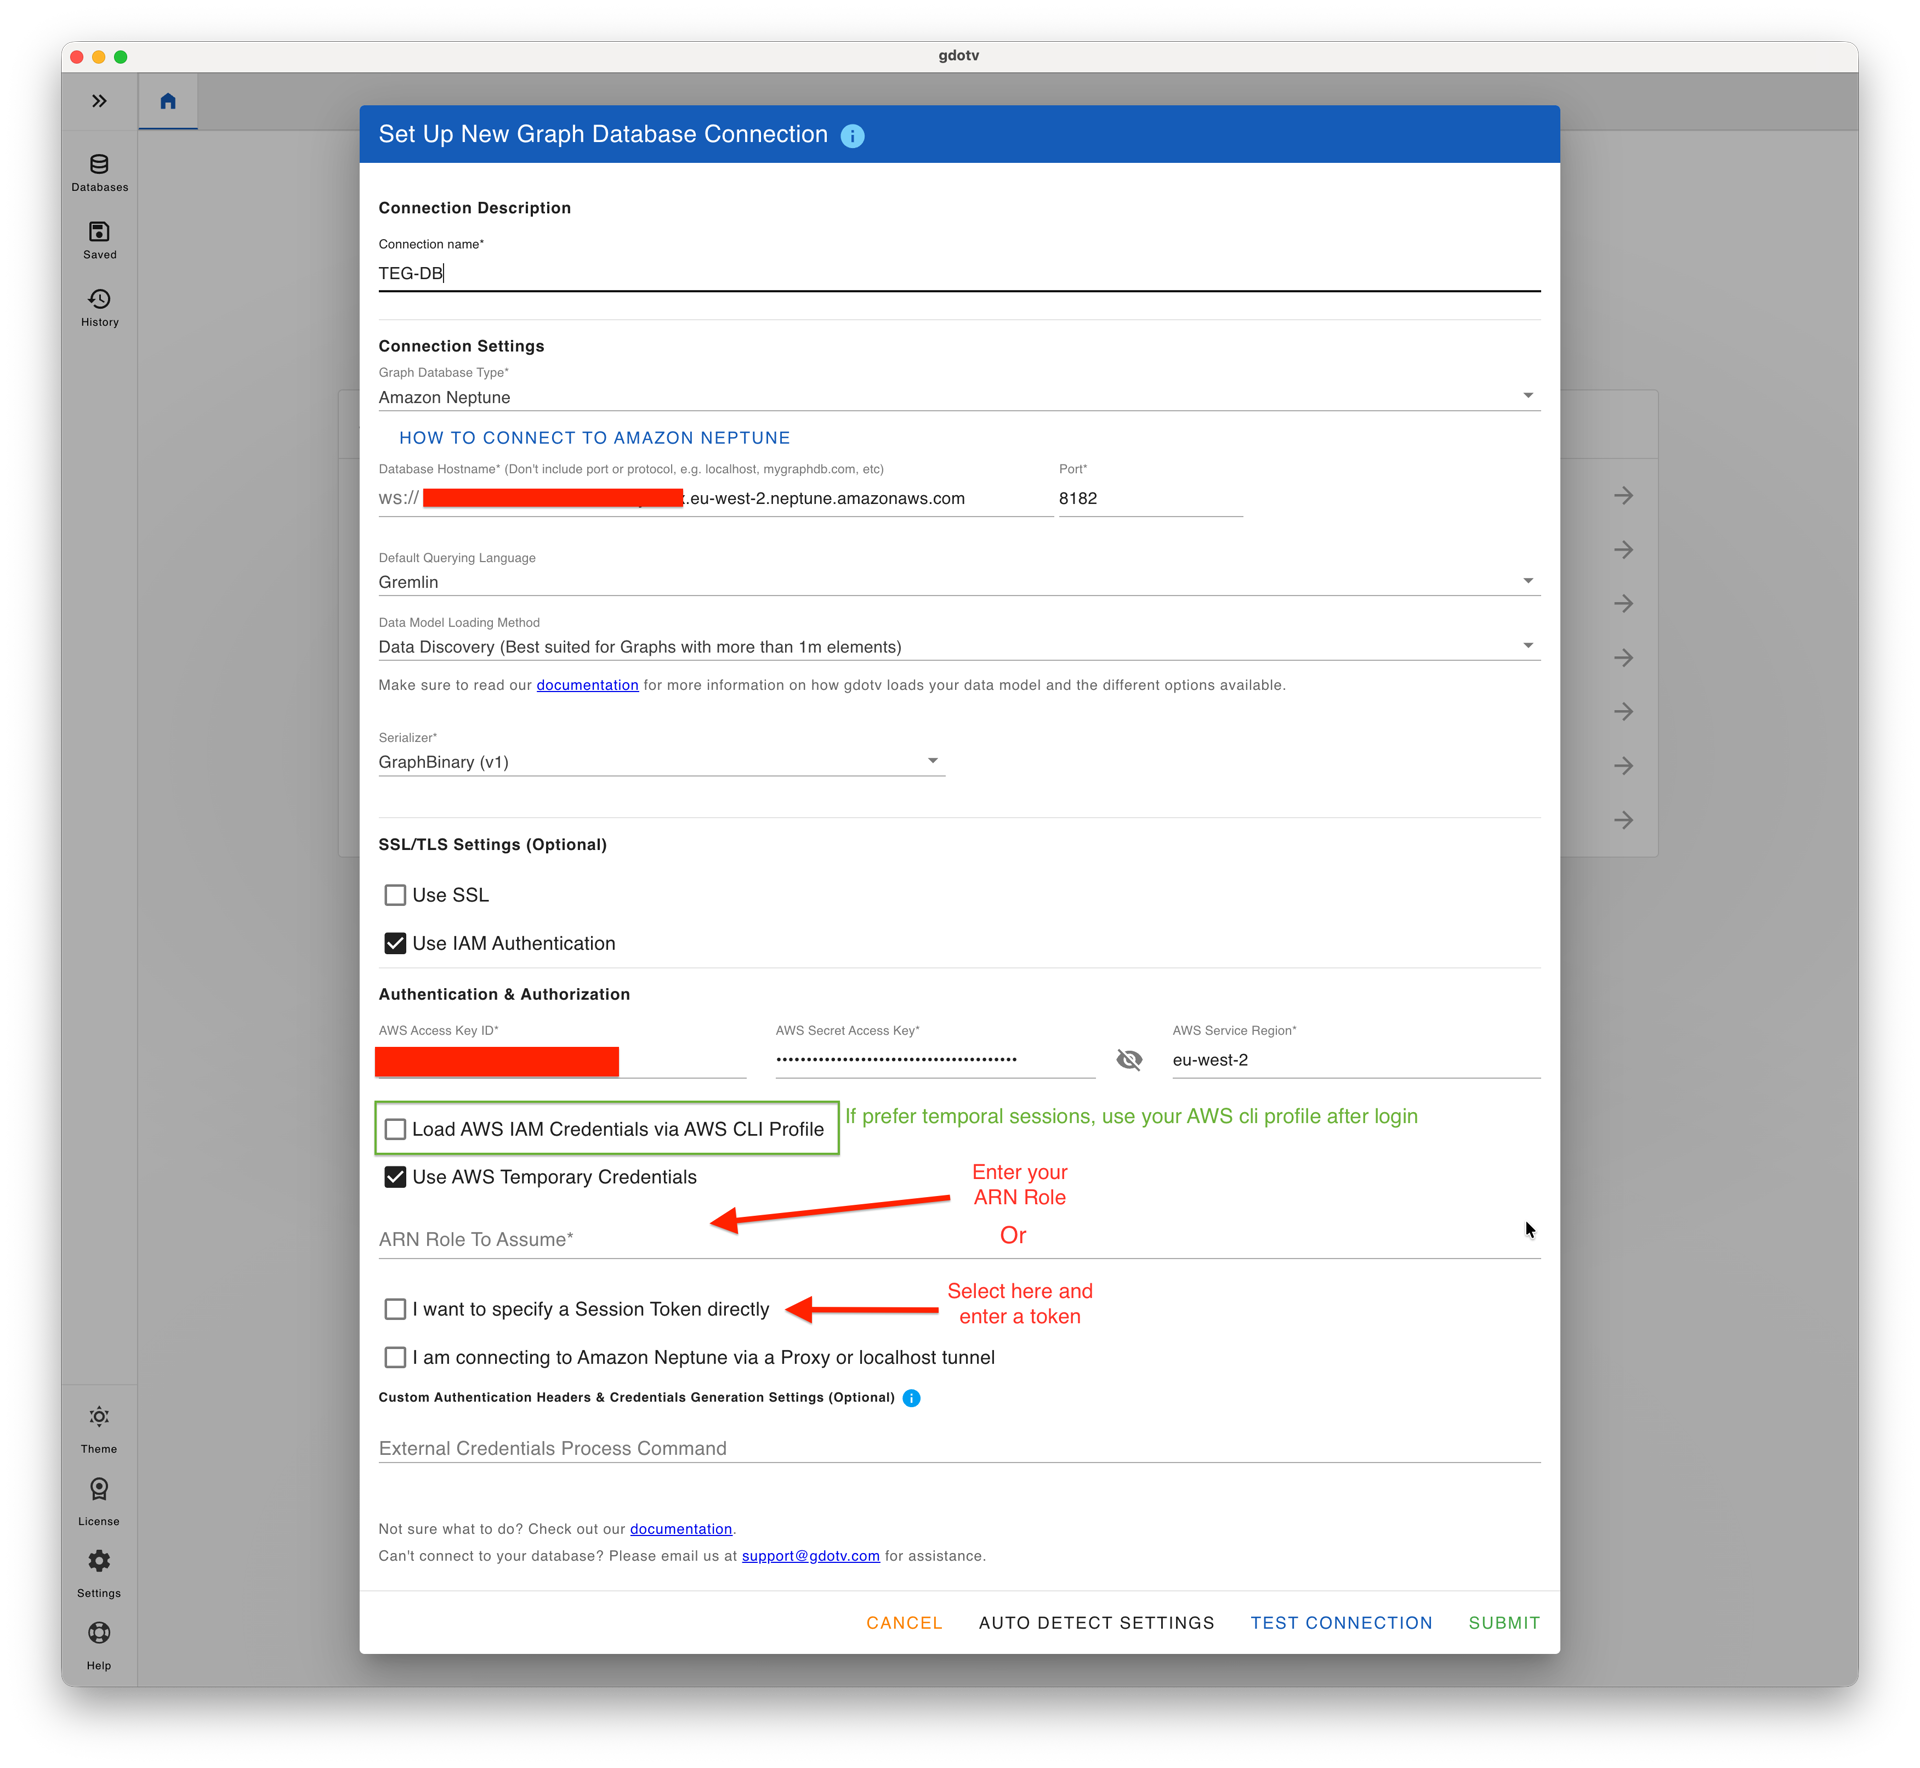
gdotv connection settings for a publicly accessible Neptune cluster, with IAM credentials supplied via AWS CLI profile export.
What Comes Next
With the bulk load complete and the connection established, Part 3 turns to exploration: browsing the loaded graph in gdotv, running Gremlin and openCypher queries to navigate edge text, and examining what the TEG benchmark’s design actually enables once the data is live inside a graph database.
References
[1] Li, Z., Gou, Z., Zhang, X., Liu, Z., Li, S., Hu, Y., Ling, C., Zhang, Z., & Zhao, L. (2024). TEG-DB: A Comprehensive Dataset and Benchmark of Textual-Edge Graphs. arXiv preprint arXiv:2406.10310. NeurIPS 2024 Datasets and Benchmarks Track.


