How does gdotv compare to Apache AGE Viewer?

Today we’ll review Apache AGE Viewer, an open source tool to view your Apache AGE data.
First, a quick review of Apache AGE itself. The AGE literally stands for ‘a graph extension’ – which is exactly what Apache AGE is, a graph-based plugin for your relational PostgreSQL database. You can learn more about Apache AGE on our dedicated page. Both PostgreSQL and Apache AGE are open-source, meaning the combination gives you a powerful and accessible approach to analysing your relational data from a graph perspective.
Speaking of perspective – exploring your graph data visually can be the quickest way to get a handle on your graph. A good visualization interface builds intuition and offers instantaneous insights about the structure of your data. This principle is something both gdotv and Apache have independently addressed, allowing you to explore your Apache AGE data from two different perspectives. Today we’re going to compare and contrast those perspectives, looking at our data with both the Apache AGE Viewer and the gdotv desktop client.
By the end of this discussion, you’ll have an idea of the strengths of each approach, allowing you to choose the best tooling for your project. (Which may be a combination of both!)
What’s the situation?
So, we start with some relational data, held in a PostgreSQL database.
We’d like to extract some graph-based insights, so we connect our PostgreSQL database to the open-source tool, Apache AGE. Apache AGE itself brings graph capabilities to the database. It does this by creating a set of two parent tables on top of your relational database, one for nodes and one for edges. You can then populate these graph tables with information from your relational database. This enables you to query your graph with Cypher and obtain graph-based insights.
If you’d like to know more, check out gdotv’s recent multi-part series where we take a deep dive on Apache AGE. That series covers what Apache AGE is, how it works, and getting started with your first Apache AGE project. For today, we’re going to assume that we already have a working Apache AGE project set up.
Now, we’d like to visualize our data. One key advantage of graph-based analytics is the ability to quickly identify relationships across data – it helps if we can see them! For Apache AGE, there are two main choices we can make:
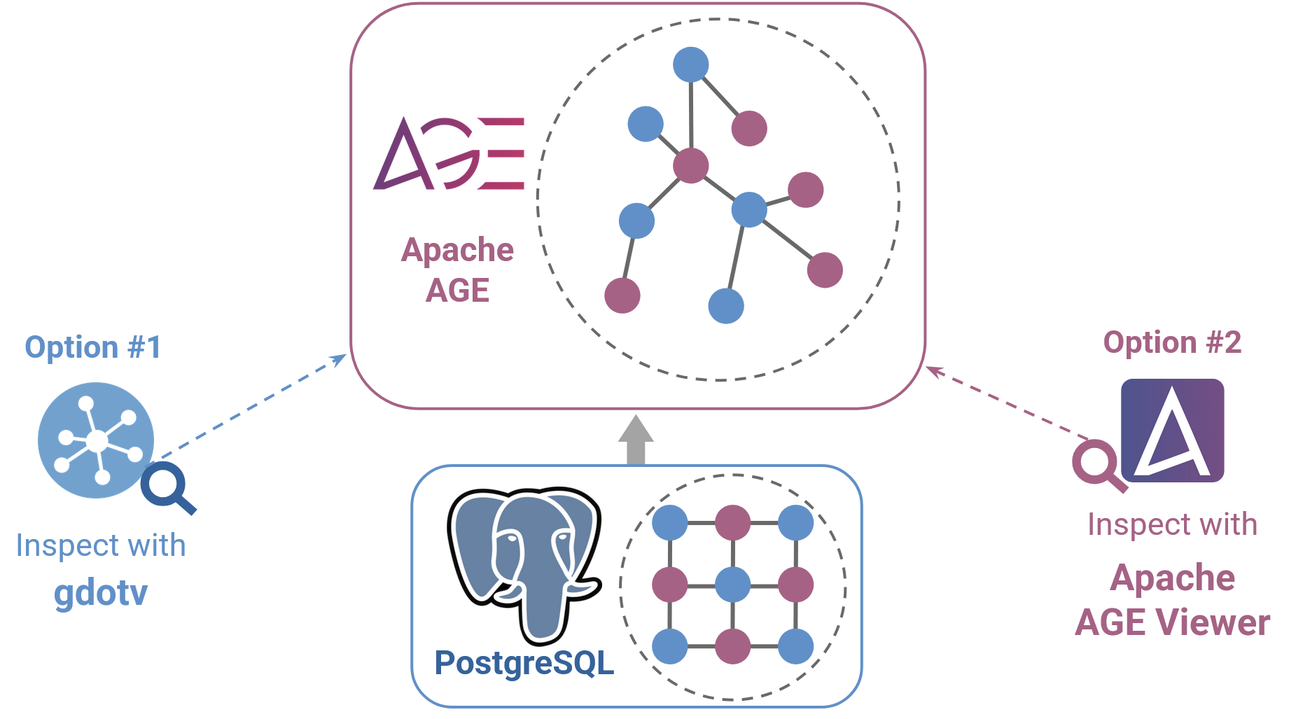
- Option #1 – gdotv, a dedicated general-purpose graph IDE client. Gdotv has been developed for a wide range of different graphs, including Apache AGE.
- Option #2 – Apache AGE Viewer, an open-source interface developed by Apache themselves as a compliment for Apache AGE
Both options are mutually compatible and non-obstrusive, since each sits on top of the database itself. So, technically, you don’t have to choose between them at all – you can try both and decide.
But it’s still useful to know how they compare, so let’s dive in.
Getting started
Again, we’ll assume that you have already set up your Apache AGE graph by following the steps in our guide.
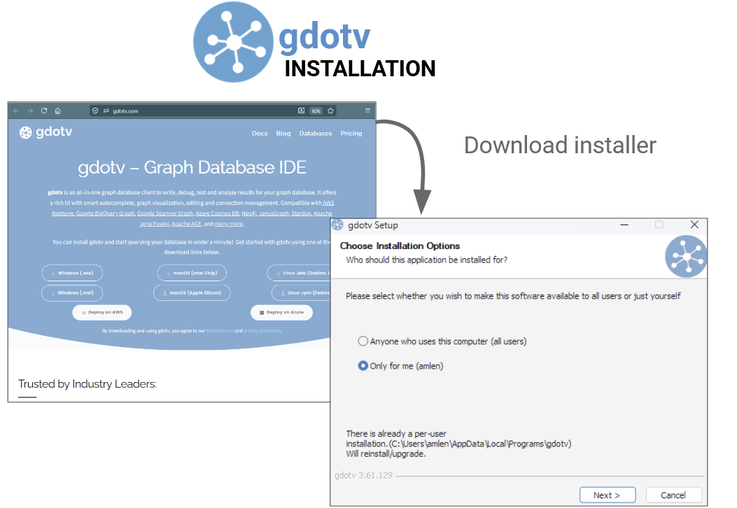
Gdotv is prepackaged, and installing it is simple. Just head on over to the download portal, select the version of gdotv that’s right for you and your operating system, then follow the on-screen instructions.
To get started with Apache AGE Viewer, you pull the repository from GitHub and follow the instructions to get installed.
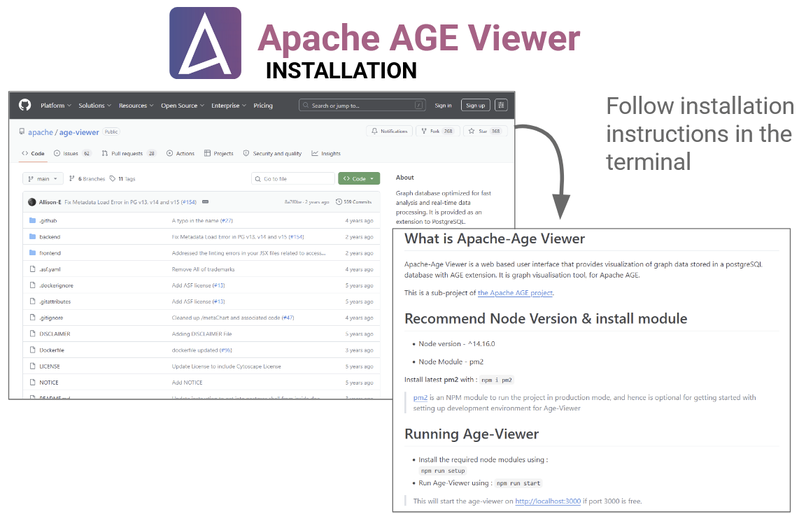
One downside of Apache AGE Viewer is that setting it up does require a little bit of know-how on operating the terminal and your environment. This is especially true, for example, if you have any Node.js versioning issues.
For example, I found I had to carefully set my environment variables to use an older version of OpenSSL, and make a manual adjustment to the code as described in this bug report. Only then did the Apache AGE Viewer work for me.
In this respect, you may find gdotv the easier choice, since everything is self-contained within its simple one-click installation. But it all depends on what you’re comfortable with.
Getting connected
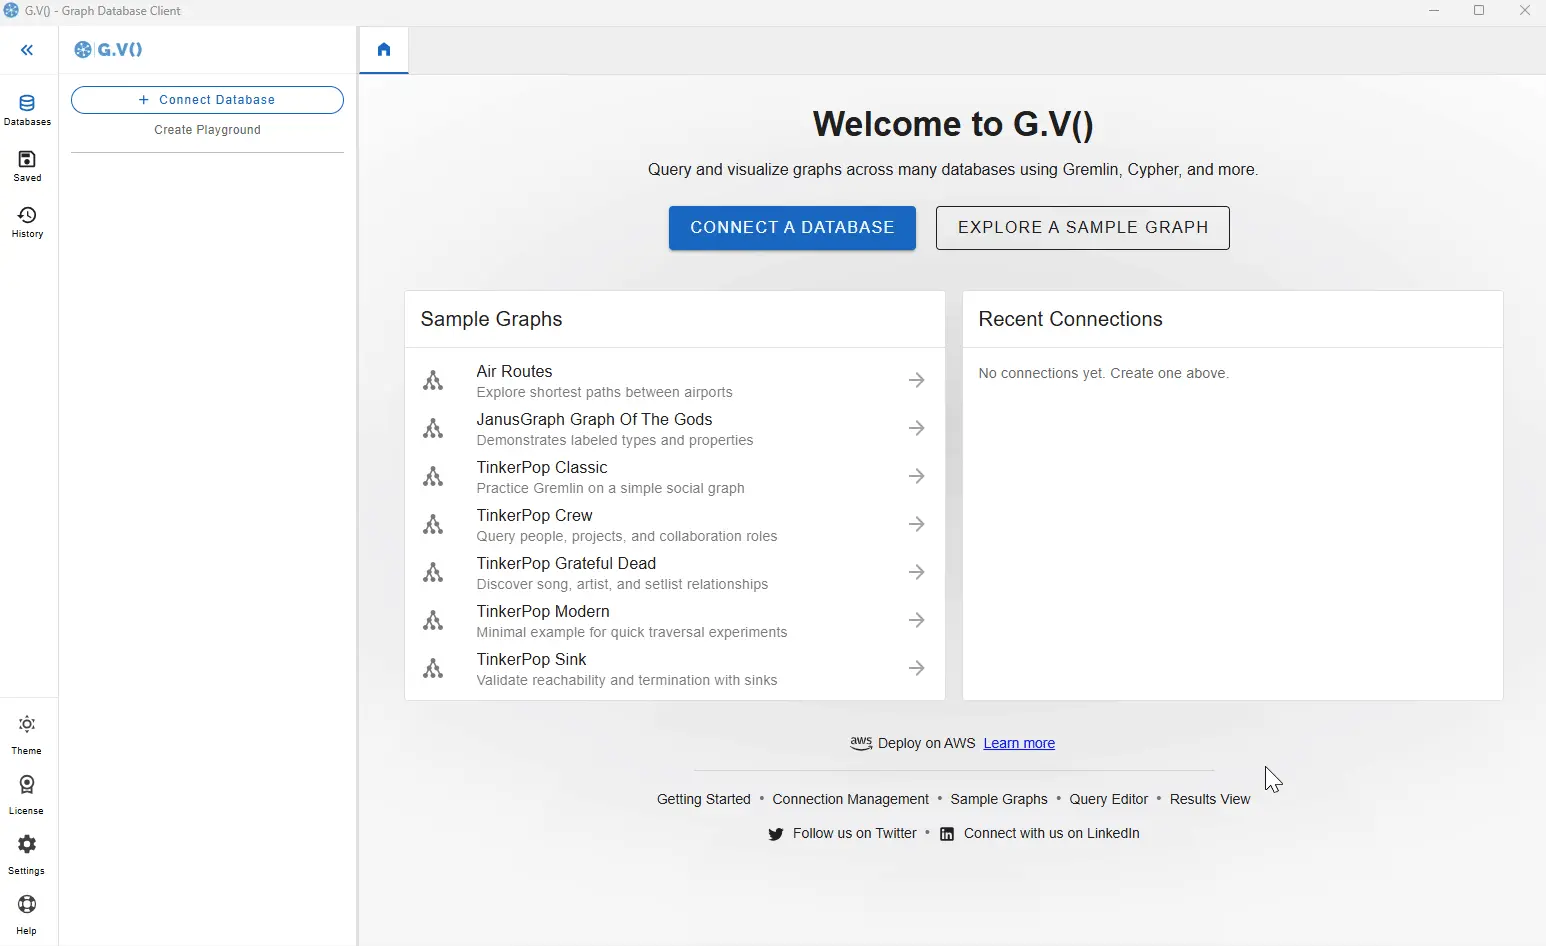
Much like the installation, connecting your Apache AGE instance to gdotv takes only a few clicks.
In principle, connecting to Apache AGE Viewer is also very simple. All you need to do is enter your connection details into the web interface.
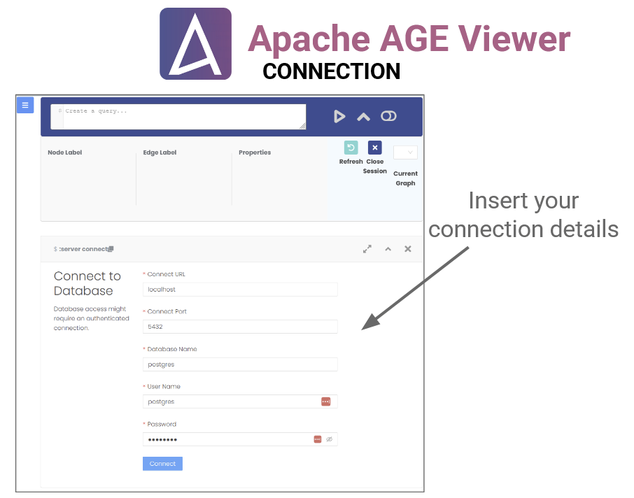
Unfortunately this is another area where you will have to be comfortable manually managing your environment. I found that I had to adjust a couple of files to make Apache AGE Viewer compatible with the latest docker image, as detailed in this bug report. Not terribly hard, but another example of potential versioning friction you may encounter with Apache AGE Viewer.
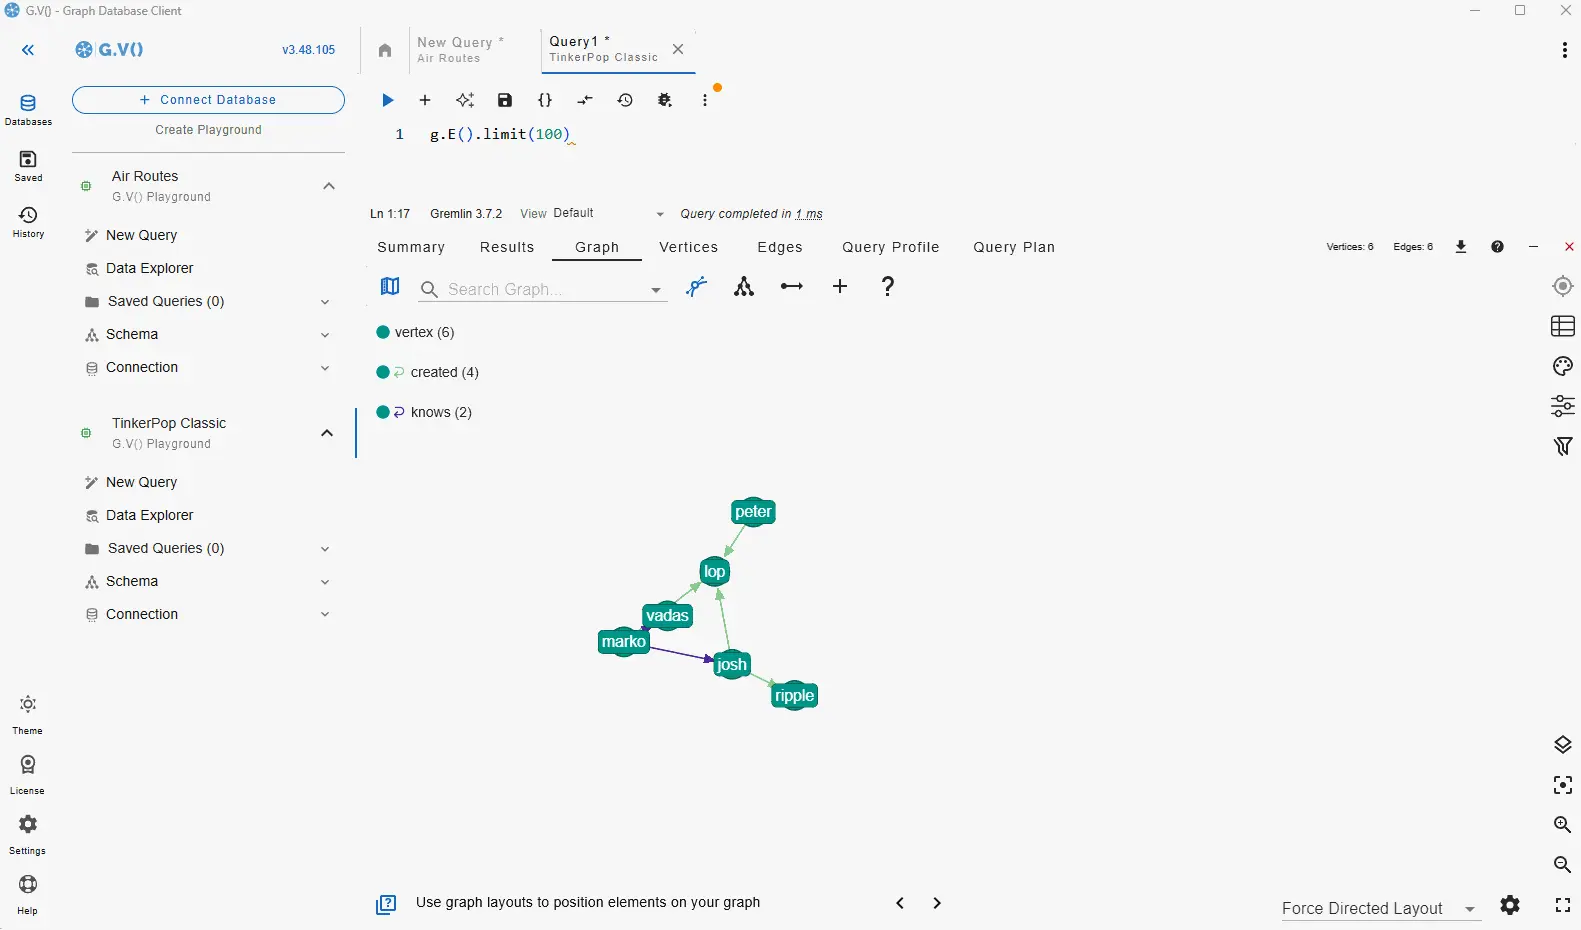
Query Editor
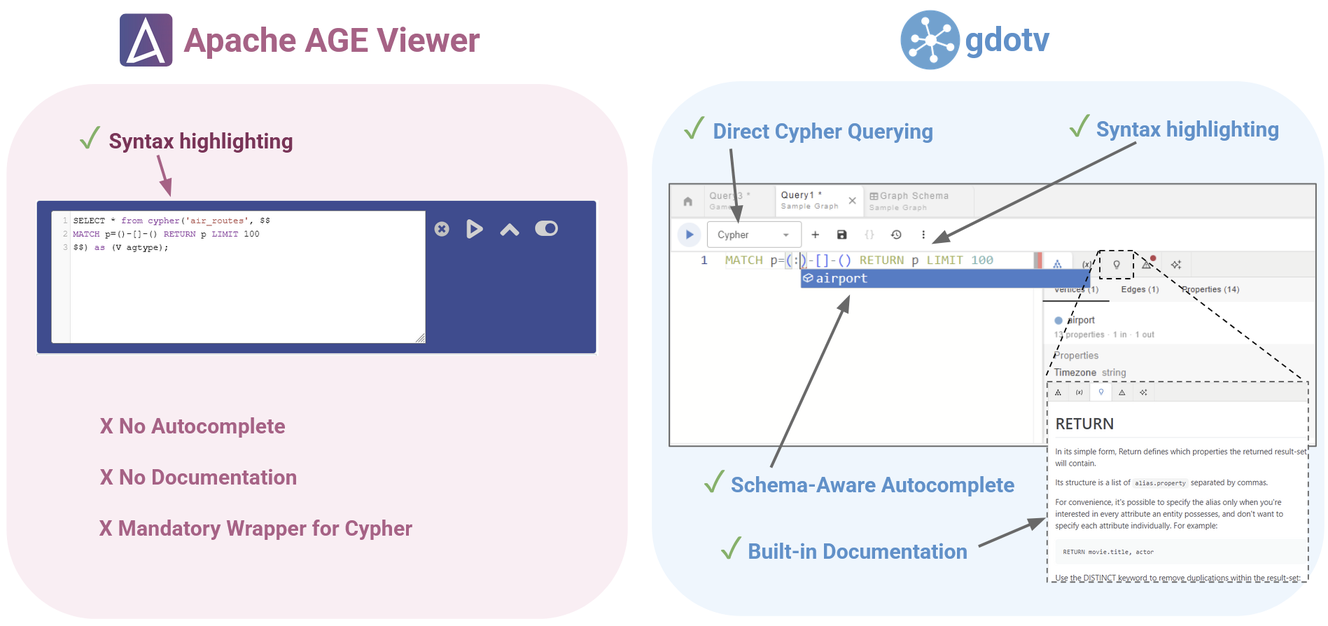
Both Apache AGE and gdotv open directly onto the SQL query editor, which is straightforward to use in both cases and both come equipped with syntax highlighting. The gdotv query editor has a few extra quality-of-life features however, like schema-aware autocomplete suggestions and in-built documentation.
Another nice convenience of gdotv is that it allows you to choose between Cypher and SQL query editors, whereas all Apache AGE Viewer queries have to be submitted in an SQL wrapper. Apache AGE Viewer does provide this wrapping in the editor, so it’s not too hard to use, but the ability to query directly in Cypher without the wrapper means gdotv has little less visual clutter and makes your query easier to read.
Visualization
Both Apache AGE Viwer and gdotv have an interactive graph visualization view. Here, you can manipulate your graph and use various kinds of customization, including colour selection, custom labels, different layouts etc.
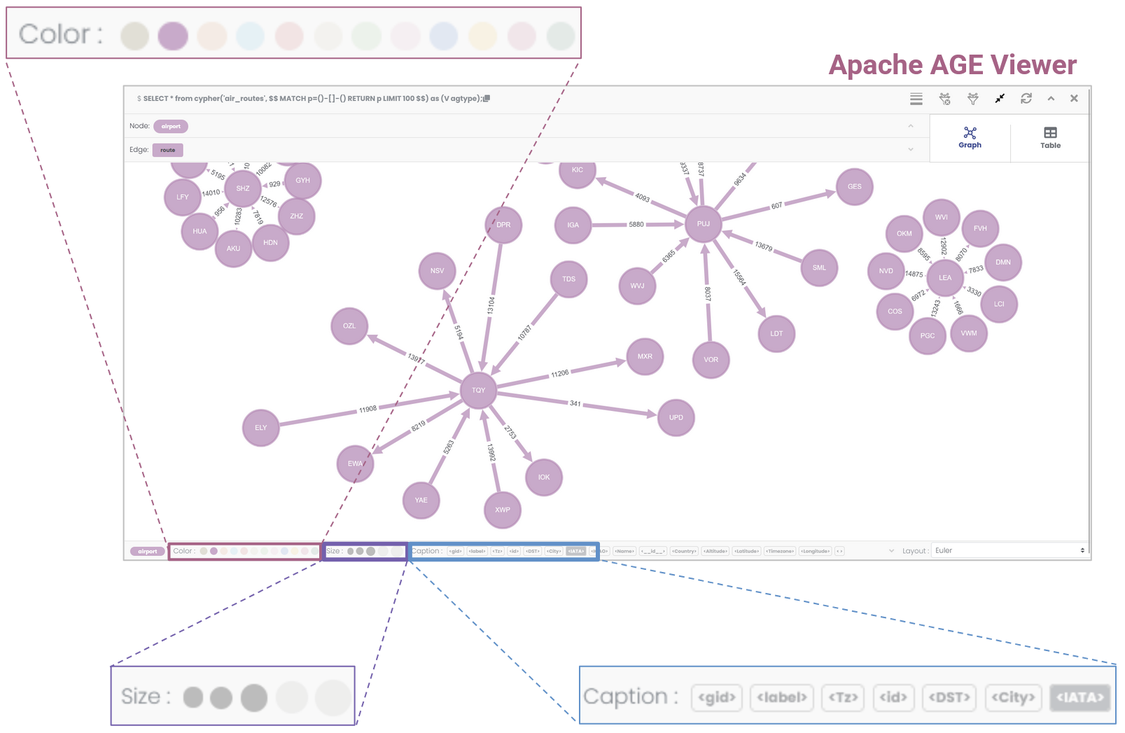
The graph visualizations for Apache AGE Viewer look good and do provide a nice, aesthetically pleasing overview of your graph, so this is definitely a plus point for Apache AGE Viewer.
The only downside is that you’re somewhat restrained in customization options. You can only choose from a preselected range of colours and sizes, and your node/edge captions are restricted to display exact properties only. So while the default view is nice, you don’t have much power to change it if you’d like something a bit different.
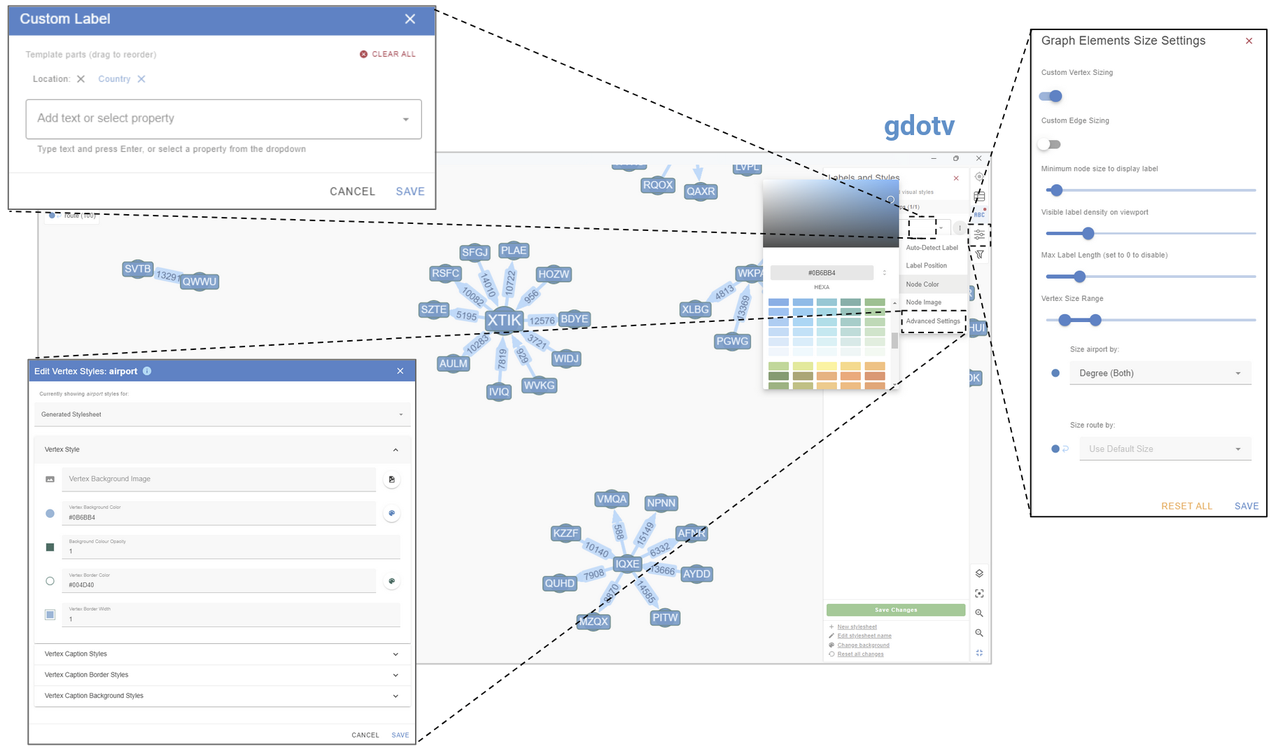
Gdotv on the other hand has a much wider range of customization options. You can pick any hex colour picker, adjust the size of nodes and edges, add pictures, use custom strings as captions, and generally customize the look as much as you like.
No-Code Features
No-code data exploration is a feature available only in gdotv. Within gdotv, you can use the Data Explorer to visualize paths in your data by just selecting the kinds of nodes and edges you want to see.
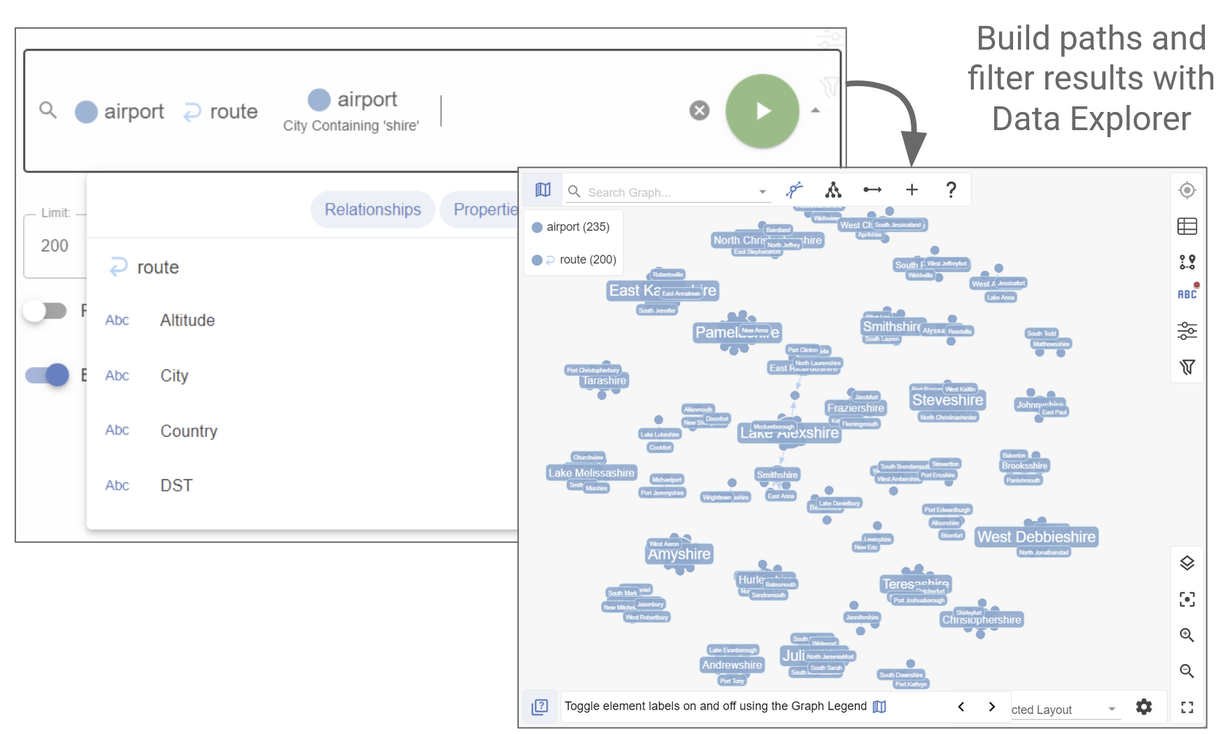
You can even apply filtering to these paths. For example, in the image shown I applied a filter to only look for Airport nodes with a City property containing the string ‘shire’.
Data Editing
Gdotv isn’t a visualization platform, it’s a fully functional graph IDE. That means that (assuming you have appropriate permissions) you can actually edit your graph data from within the gdotv client.
Apache AGE Viewer is visualization-only, so there is no comparable feature.
Schema Overview
Another property that seems to be exclusive to gdotv is the Data Model view, which allows you to visualize the schema of your graph, as shown for this simple air routes data set:
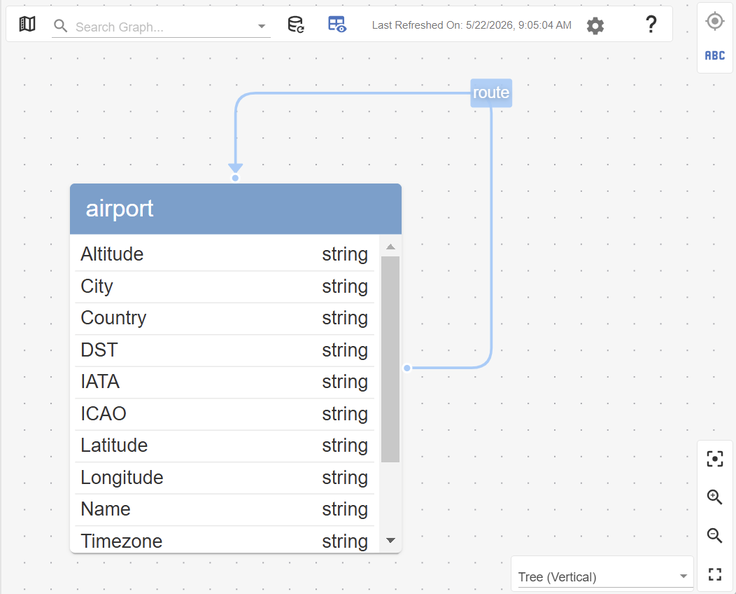
When exploring Apache AGE Viewer, I couldn’t find a similar feature. It would display the types and number of nodes/edges in my data, but didn’t show me the relationships between them.
I also couldn’t find any mention of any schema view in the documentation, so I would tentatively conclude that Apache AGE Viewer likely doesn’t have this functionality.
Database Compatibility
As the name would suggest, Apache AGE Viewer is only compatible with Apache AGE graphs. If you have multiple Apache AGE graphs, then you also have to open multiple instances of Apache AGE Viewer to view them. For this reason, you may find Apache AGE Viewer limited for use beyond a single Apache AGE graph.
Gdotv on the other hand, is compatible with a wide variety of databases across the graph database landscape. This includes graph-on-relational databases like Apache AGE, Google Spanner Graph and Puppygraph, native labelled property graphs like Neo4j, JanusGraph and Aerospike, RDF triplestore graphs like Apache Jena, Stardog and QLever, as well as many more. Within gdotv, you can manage an unlimited number of connections, Apache AGE or otherwise, all from a single interface.
Cost
Apache AGE Viewer is a free, open source framework, whereas gdotv is a commercial product you buy. In this respect, there is no downside to trying Apache AGE Viewer first to see if the functionality is good enough for your purposes, before seeing if the additional functionality of gdotv might be worth the cost of purchasing additional tooling. (Of course, gdotv also has a free trial, so there is no downside to trying that either.)
Summary
In conclusion, both packages serve different niches.
Apache AGE Viewer is a free and open source platform that offers simple, straightforward visualization functionality, and it’s good at it. If all you want is to get a first look at your Apache AGE data, then Apache AGE Viewer may be all you need.
If you want a more powerful and accessible client that helps you manage complex queries and lets you get hands-on with your data and visualization, you may find gdotv a better fit. It’s a fully integrated graph IDE designed for developers across the industry.

