The Weekly Edge: BigQuery Graph Goes Big, RDF 1.2 Advances, TinkerPop Hatches 3 New Gremlins, & more

If you only just finished filing your U.S. taxes, you now have the perfect excuse to relax and unwind: The Weekly Edge is back, baby! (from spring break, that is; I filed my taxes in February like a normal person)
Yesterday (15 April) was also Jackie Robinson Day, and as it happens, graph databases have something to say about Jackie Robinson and baseball this week. 🤔 More on that below.
Here’s this week’s lineup of graph tech news:
- Google drops the velvet rope: BigQuery Graph enters public preview and you can bring Spanner Graph along for the ride too
- The W3C grinds slow but exceedingly fine: Two more RDF 1.2 specifications advanced toward candidate recommendation status
- Three’s a crowd: Apache TinkerPop drops a triple release this week, including a 4.0.0 beta
- It’s those KGs, they’re so hot right now: Digital Science acquires Ontopic and its virtual knowledge graph technology
- You’re killing me, Smalls: Whether or not you love baseball, you’ll love this graph visualization of every home run in MLB history
In case you’re new here, the Weekly Edge is your tl;dr of graph technology news curated by the team at gdotv, rounding up everything worth reading, watching, or forking from the past seven-ish days (or so) from the world of connected data.
// It’s time to level up your graph game: Query, explore, edit, and visualize your connected data with the gdotv graph IDE. Try it out with a 1-month, no-fuss free trial.
Let’s get into it.
[News:] BigQuery Graph Goes Big in Public Preview
Remember back in the winter winds of February when the Weekly Edge first reported that Google BigQuery Graph had quietly entered private preview? Well, the Google Cloud team just kicked the velvet rope aside: BigQuery Graph is now officially in public preview – and it came with quite a launch party.
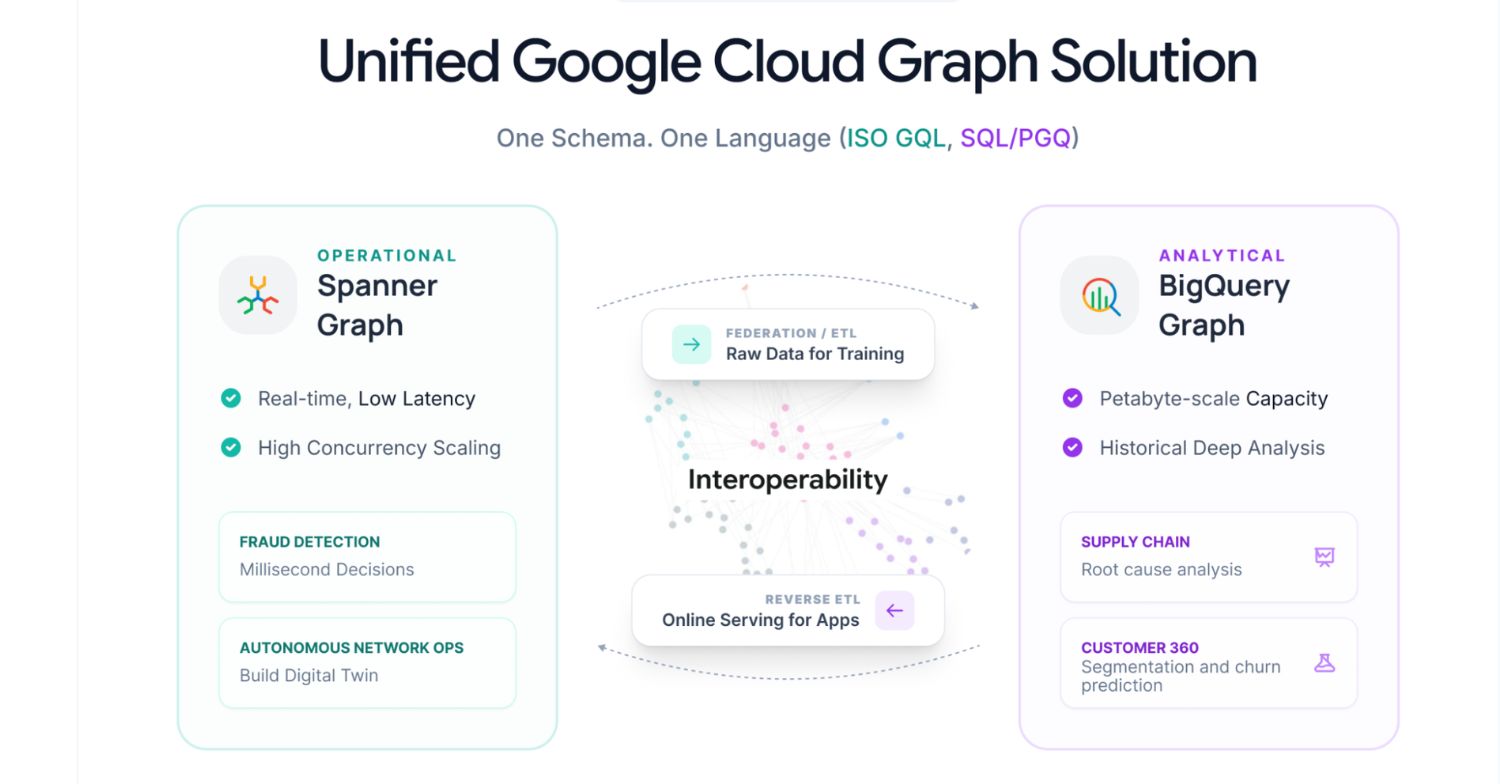
In a pair of announcements from Bei Li, Candice Chen, and Vinay Balasubramaniam at Google Cloud, the team introduced BigQuery Graph as a serverless graph analytics layer built directly on top of BigQuery – no separate graph database, no ETL, no data movement. You map your existing BigQuery tables to a GQL-queryable graph schema and off you go. In the history of graph databases, that’s big news (sorry, couldn’t help myself), but more importantly, it’s another vendor vote for the Graph Query Language standard.
A companion announcement covers how BigQuery Graph and Spanner Graph work as a unified solution: Spanner Graph handles your real-time, OLTP transactional graph queries while BigQuery Graph takes care of the OLAP heavy lifting for graph analytics. And (hint hint), you can use both BigQuery Graph and Spanner Graph with gdotv to help you write and debug queries, visualize your data, and no-code explore the results.
[News:] The W3C Advances 2 More RDF 1.2 Specifications
After more than three years in the making, the W3C RDF & SPARQL Working Group is inching ever closer to the finish line. Ora Lassila – the Albus Dumbledore of RDF and one of the co-chairs of the original Resource Description Framework specification – shared the news on LinkedIn that the working group has now advanced two more RDF 1.2 specifications: RDF 1.2 Concepts & Abstract Data Model and RDF 1.2 Semantics to “Candidate Recommendation” status. 🫨
The headline feature of RDF 1.2 is triple terms (formerly known as RDF-star), which lets you make statements about statements, which, turns out, unlocks significantly richer graph data modeling. RDF triple terms would allow you to add metadata directly to edge relationships without requiring old-fashioned (and annoying) reification.
If you followed the RDF 1.2 coverage in the 2025 Yearly Edge, this is that story continuing to move forward at the speed of W3C standards processes (which is to say: steadily, deliberately, and with impeccable documentation).
//
[Release:] 3 New Releases from Apache TinkerPop (including a 4.0.0 beta)
Arise, Gremlins! 👹 Apache TinkerPop just dropped a trio of releases announced on LinkedIn last week: 3.7.6, 3.8.1, and the headliner, 4.0.0-beta.2.
The two maintenance releases (3.7.6, and 3.8.1) bring stricter mergeE/mergeV validation, session connection reuse for better transaction performance, and significantly improved Gremlin formatting – small but satisfying wins for anyone currently living in the 3.x world.
The big news tho is 4.0.0-beta.2: all five language drivers (.NET, Go, and JavaScript now join Java and Python) have been migrated to the new HTTP-based communication model with standardized canonical Gremlin scripts, built-in authentication via request interceptors, and re-enabled transaction support in Java. There’s also a new Gremlin MCP server for AI-assisted query translation and formatting – because even my kitchen toaster has an MCP server now, so it’s about time. 😅
ICYMI, the second edition of Practical Gremlin just dropped a few weeks back, so if you’re using gdotv with Gremlin Server, now you have a new beta release to practice with.
[News:] Digital Science Acquires Ontopic Knowledge Graph Tooling
Further proof (if you needed it?) that the knowledge graph space keeps heating up: Digital Science has recently acquired Ontopic, a pioneer in virtual knowledge graph (VKG) technology originating from the Free University of Bozen-Bolzano in Italy.
Ontopic – whose CEO and Co-Founder Peter Hopfgartner called the deal “a pivotal moment” – is best known for Ontop, the leading open source framework for VKGs and ontology-based data access (OBDA). The core idea behind VKGs is that you build a semantic layer over your existing data without copying or moving a byte. Your data stays put; the graph comes to it.
Following the acquisition, Ontopic Studio will be integrated with metaphactory, Digital Science’s knowledge democratization platform. The Ontopic team joins Digital Science’s newly formed Knowledge Graph Competency group, which also serves products like Dimensions and Altmetric. Congrats to the Ontopic team! 💰 💰 💰
[For Fun:] A Graph Visualization of Every Home Run in MLB History
Full disclosure: I am that kid from The Sandlot who didn’t know who Babe Ruth was. (I literally learned it from the movie.) I might know more about baseball than Emil Eifrem in that I can use a curveball metaphor correctly, but that’s a low bar to step over. However, this week’s watch got even me interested in baseball history.
This video from adumb (also on Bluesky) is a graph visualization of every home run in the history of Major League Baseball. His comprehensive graph viz includes 15,000+ players, 334,000+ home runs, and data that goes all the way back to 1901. He even uses graph algorithms like degree centrality and edge betweenness centrality to surface facts you’d never find any other way.
If you know nothing about baseball (hi), this is a great entry point. If you love baseball, clear your afternoon.
P.S. My colleague Geoff wrote up an amazing data visualization walkthrough on how to create stunning (and effective) dashboards using gdotv. 📊
P.P.S. Are you attending the Knowledge Graph Conference in New York City this May? So am I! Here are a few of the don’t-miss sessions at KGC that you’ll want to attend. 🧠
P.P.P.S. Got an item to nominate for the next edition of the Weekly Edge? Hit me up at weeklyedge@gdotv.com. ✍🏽


