Pitting gdotv Against AWS Graph-Explorer (LPG)
")
When you’re working with graph databases, your tooling matters. The right client can make the difference between a productive day and a frustrating one. Here, we take a side-by-side look at AWS Graph Explorer and gdotv, two tools that both let you interact with your AWS Neptune Cluster or graph database, but approach the job in very different ways.
Overview of AWS Graph Explorer & gdotv
AWS Graph Explorer is an open-source, low-code visual exploration tool for graph data. Built as a React-based web application, it’s primarily designed for non-technical users such as data scientists, business analysts, and others who need to explore graph data without learning a query language. It supports AWS Neptune, as well as other graph databases that implement standard Gremlin or SPARQL endpoints, and can be self-hosted across a range of environments.
gdotv is a commercial graph database IDE built for developers and data professionals. It is available as a desktop application for Windows, macOS and Linux, and also on AWS Marketplace (and more cloud platforms in the near future). Described as an all-in-one client, gdotv covers the entire workflow as opposed to just exploration, from a feature-rich query editor to results and schema visualization, with plenty more in between
Let’s at what it actually takes to get each tool up and running.
Installation & Setup
How easy you find AWS Graph Explorer to set up will depend on how many similar tools you’ve used. Since it’s a self-hosted web application rather than a downloadable client, you’ll need to deploy it yourself before you can use it. The recommended route is via Docker. You’ll need to have Docker installed, pull the image, and run the container with the appropriate environment variables and network configuration to reach your database. Alternatively, you can deploy it on an Amazon EC2 instance or through SageMaker, but both of those options bring their own infrastructure overhead. None of this is insurmountable though, and AWS provides documentation to guide you through it.
For those comfortable self-hosting their own application, this will be no problem, and Graph Explorer’s self-hosted/open-source nature can be an advantage for teams with specific deployment requirements or cost constraints.
However, for the non-technical user, the need to deploy your own instance could mean a significant amount of work before you’ve even begun looking at your graph. You might find this somewhat at odds with AWS Graph Explorer target audience of non-coders and non-developers. In practice, these non-technical users will likely get the most out of AWS Graph Explorer if they have other members of their team set up the tool in advance.
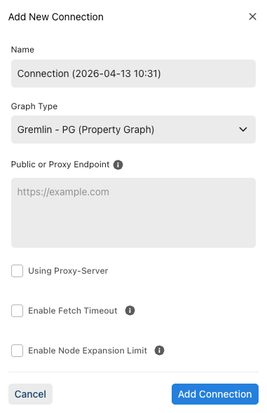
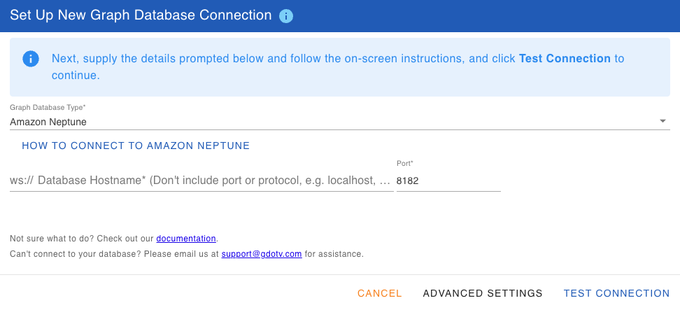
Installing and setting up gdotv is very straightforward. As a desktop application, it’s downloadable straight from the website, and installable with a single (double) click. Connecting to your Neptune instance is as simple as adding a new connection, and supplying your database hostname and port.
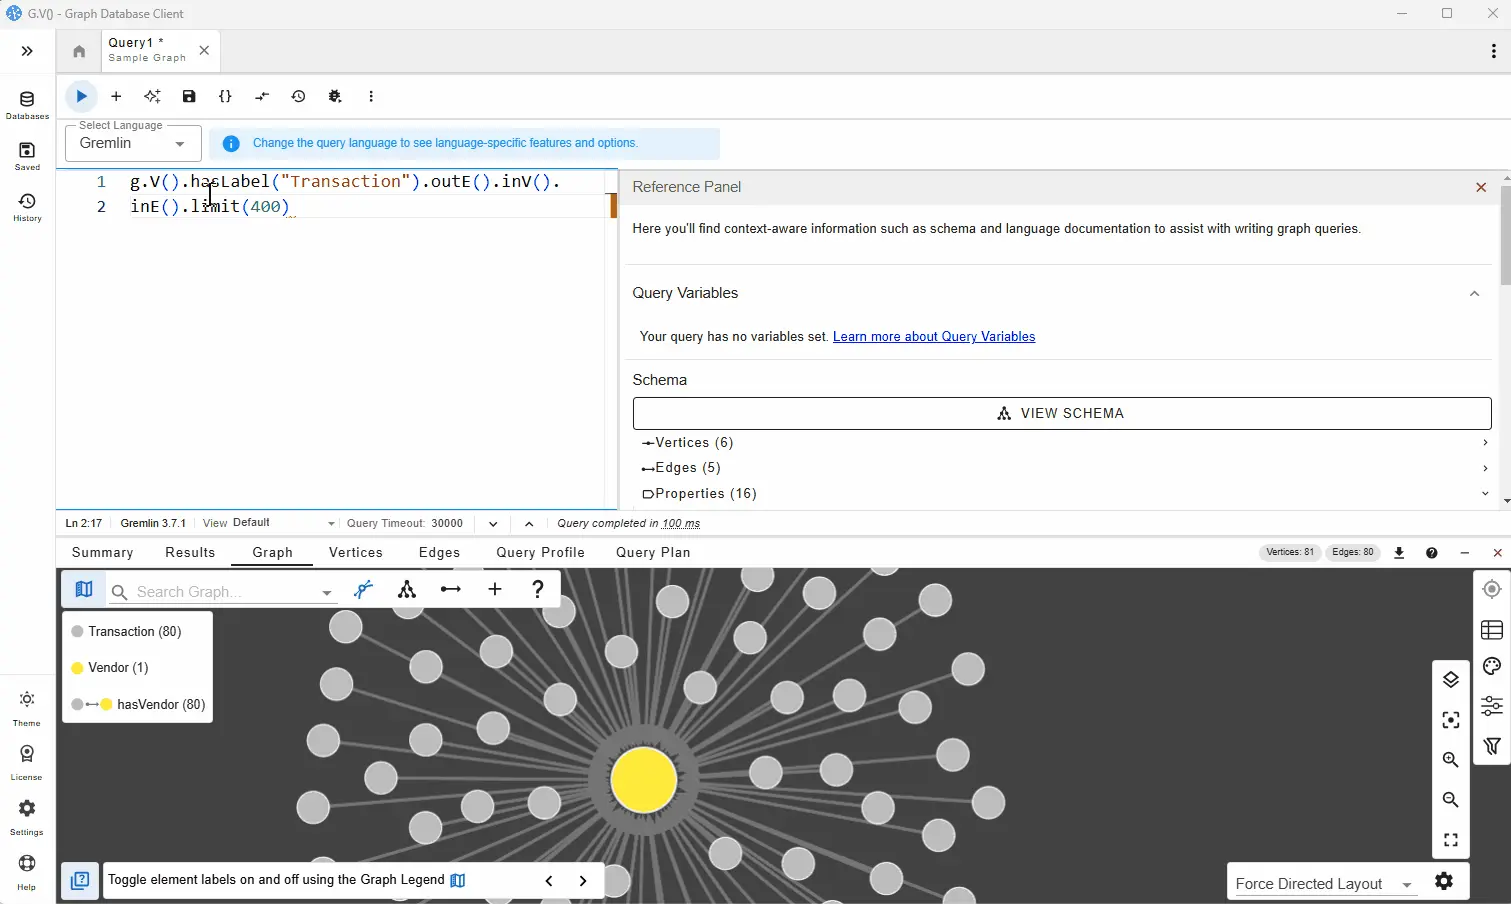
This will open a new query window, with the schema at the side, from which you can write and run a query straight away. All of this from start to finish should take less than 5 minutes.
Though gdotv is primarily targeted at developers, non-technical users may find this low barrier to entry actually makes gdotv the easier product to use if they are unsure how to set up AWS Graph Explorer.
Querying
gdotv offers full Gremlin and Cypher (+SPARQL, if you’re looking for AWS Neptune RDF) query editors which you can toggle between, with real-time autocomplete, suggestions, and embedded documentation informed by your graph data schema and each language’s official docs.
gdotv’s query editor comes with a wide range of features, many of which are detailed on the gdotv’s AWS Neptune Landing Page if you would like to learn more.
AWS Graph Explorer is explicitly designed for people who want to explore their data without writing queries, so it is not primarily designed for querying. That said, it does have a rudimentary editor for Gremlin.
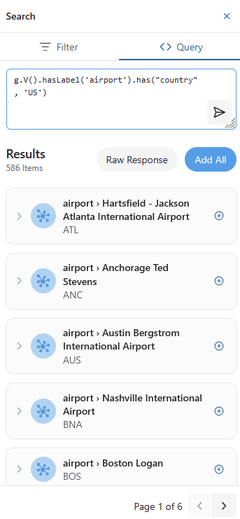
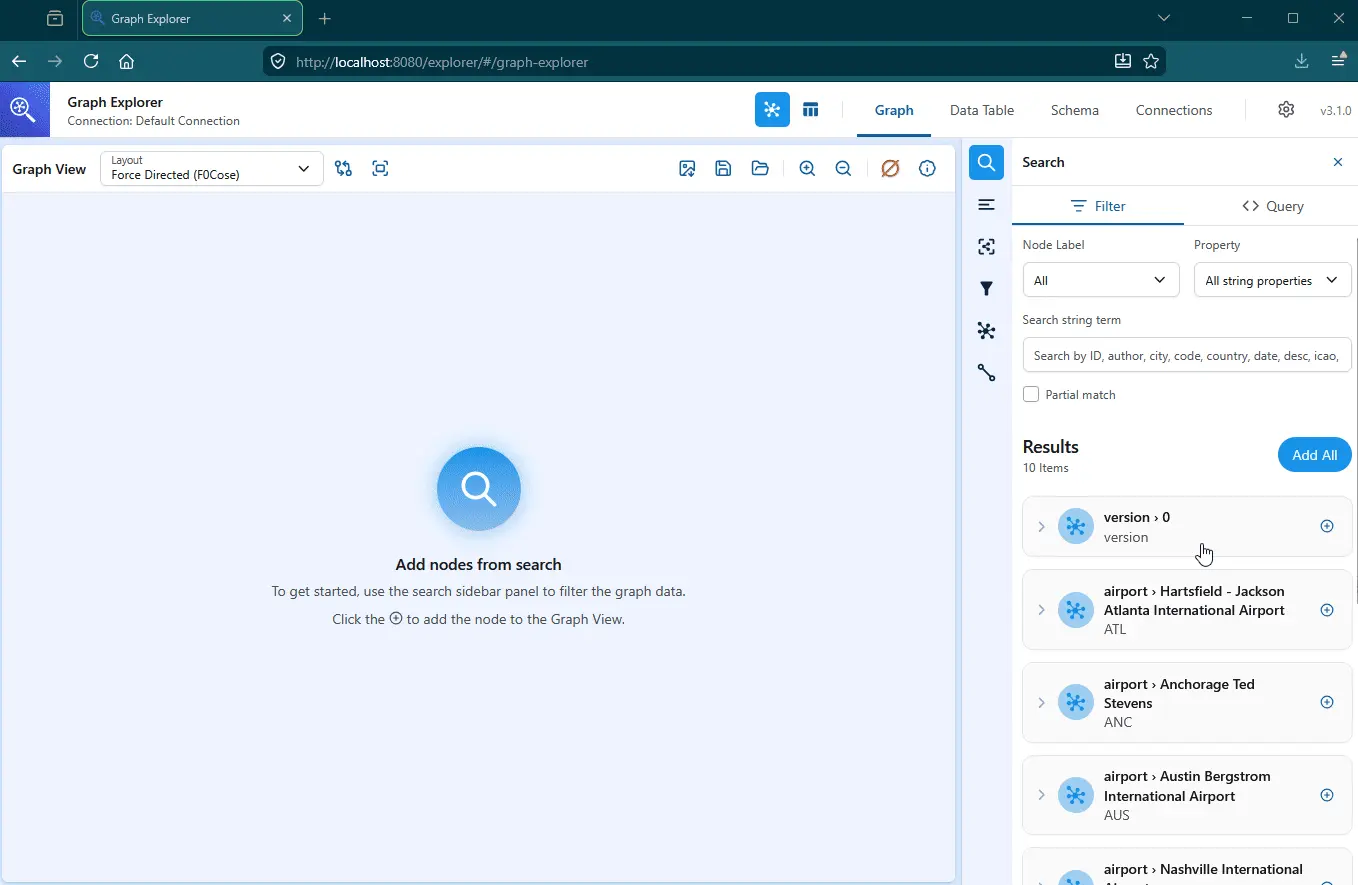
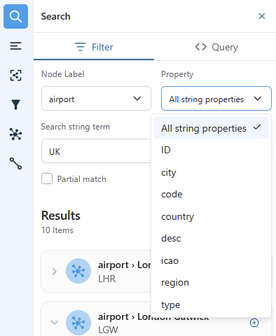
So how do you initialize a graph visualization in AWS Graph Explorer without queries? In order to populate the canvas, you need to use the search function in the sidebar to find nodes, and then add them.
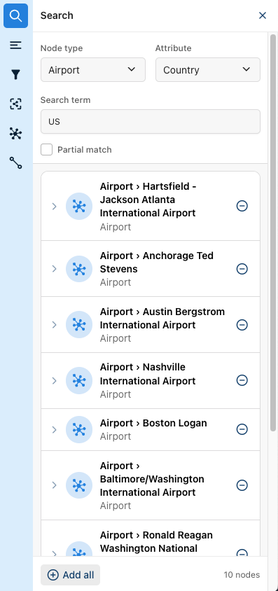
The search is easy to get to grips with and works fine for simple cases. You can filter by node type and attribute, and search across that attribute’s values. This is limited in a few ways though. Only the first 10 results are shown, with no way to paginate through the rest. This will hold back anyone working with a larger dataset as you would need to be very specific with the search criteria, made more difficult by only having one search term to work with.
The AWS Graph Explorer query editor works similarly and doesn’t have a limit on the number of results, but as the editor is just a plain text box, you will likely have to be very comfortable querying with Gremlin to use it.
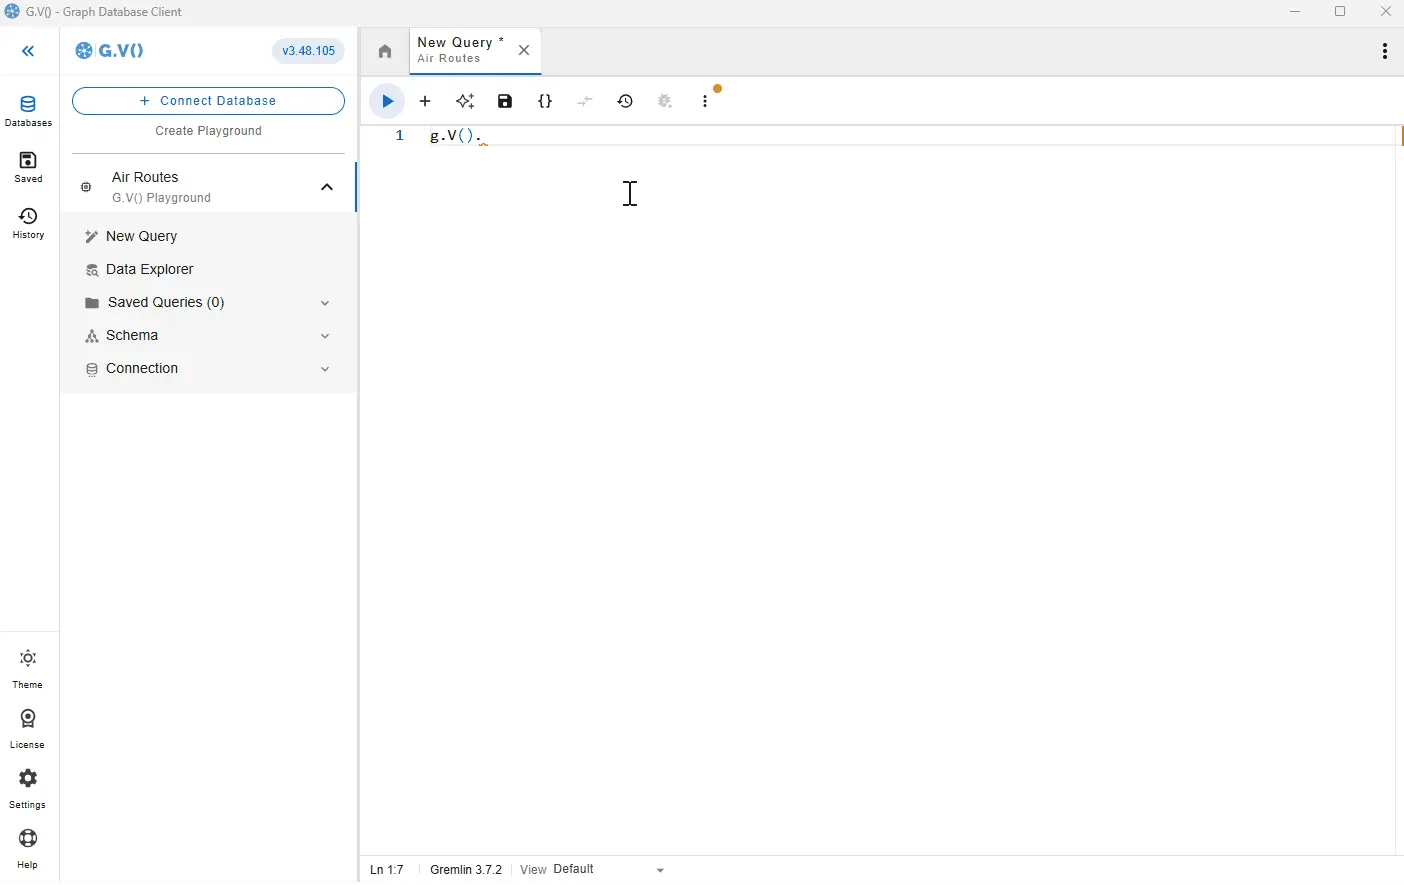
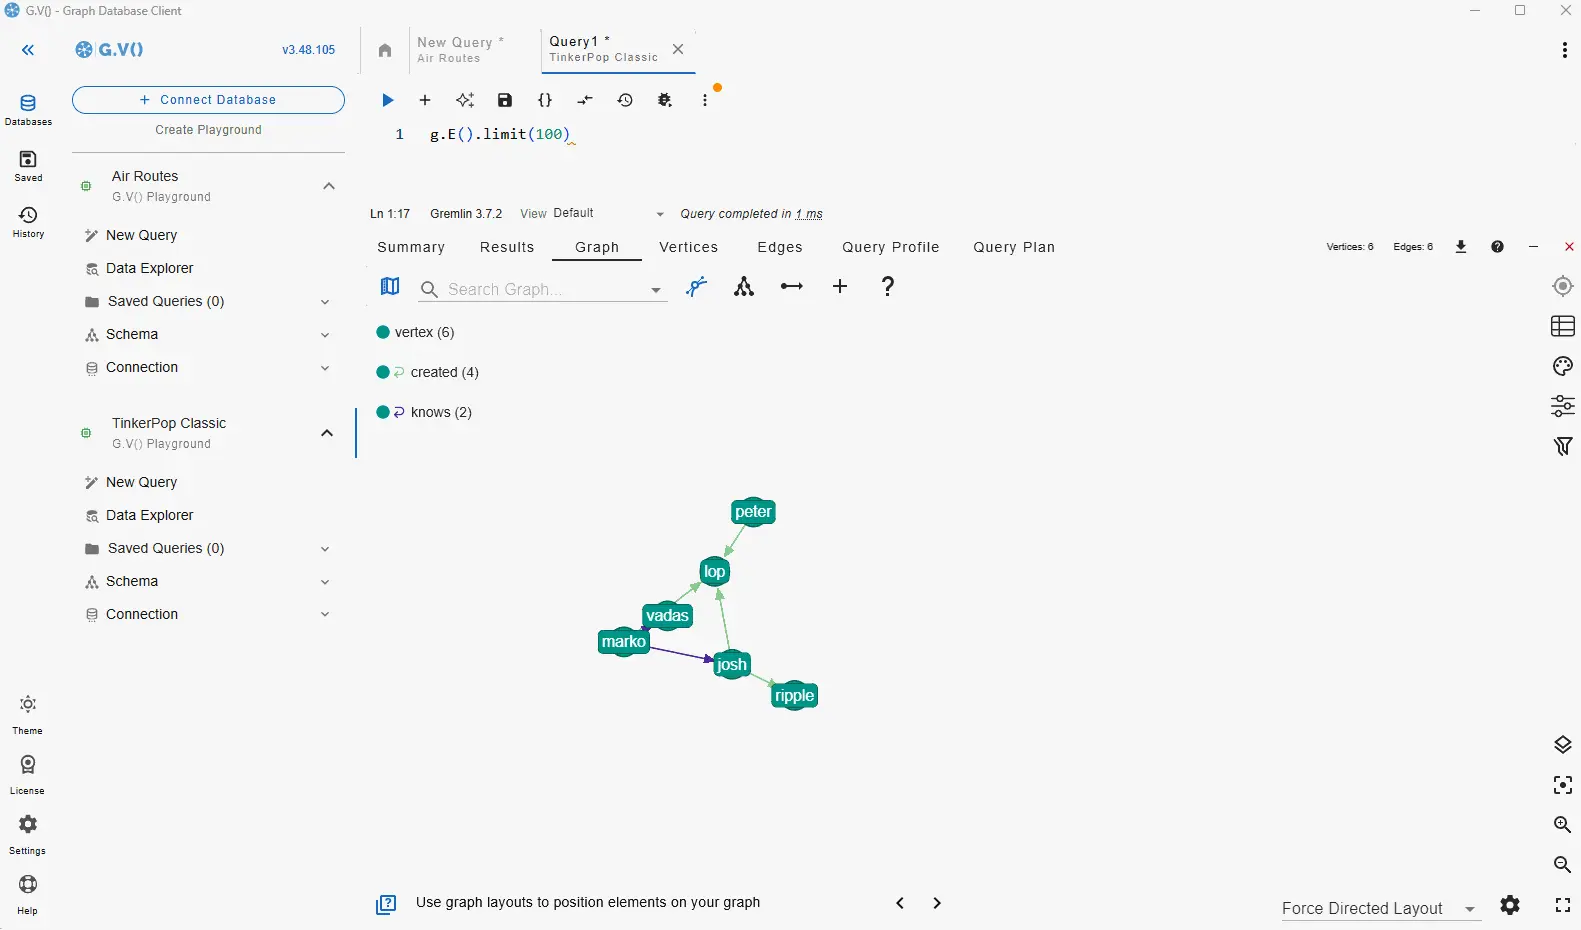
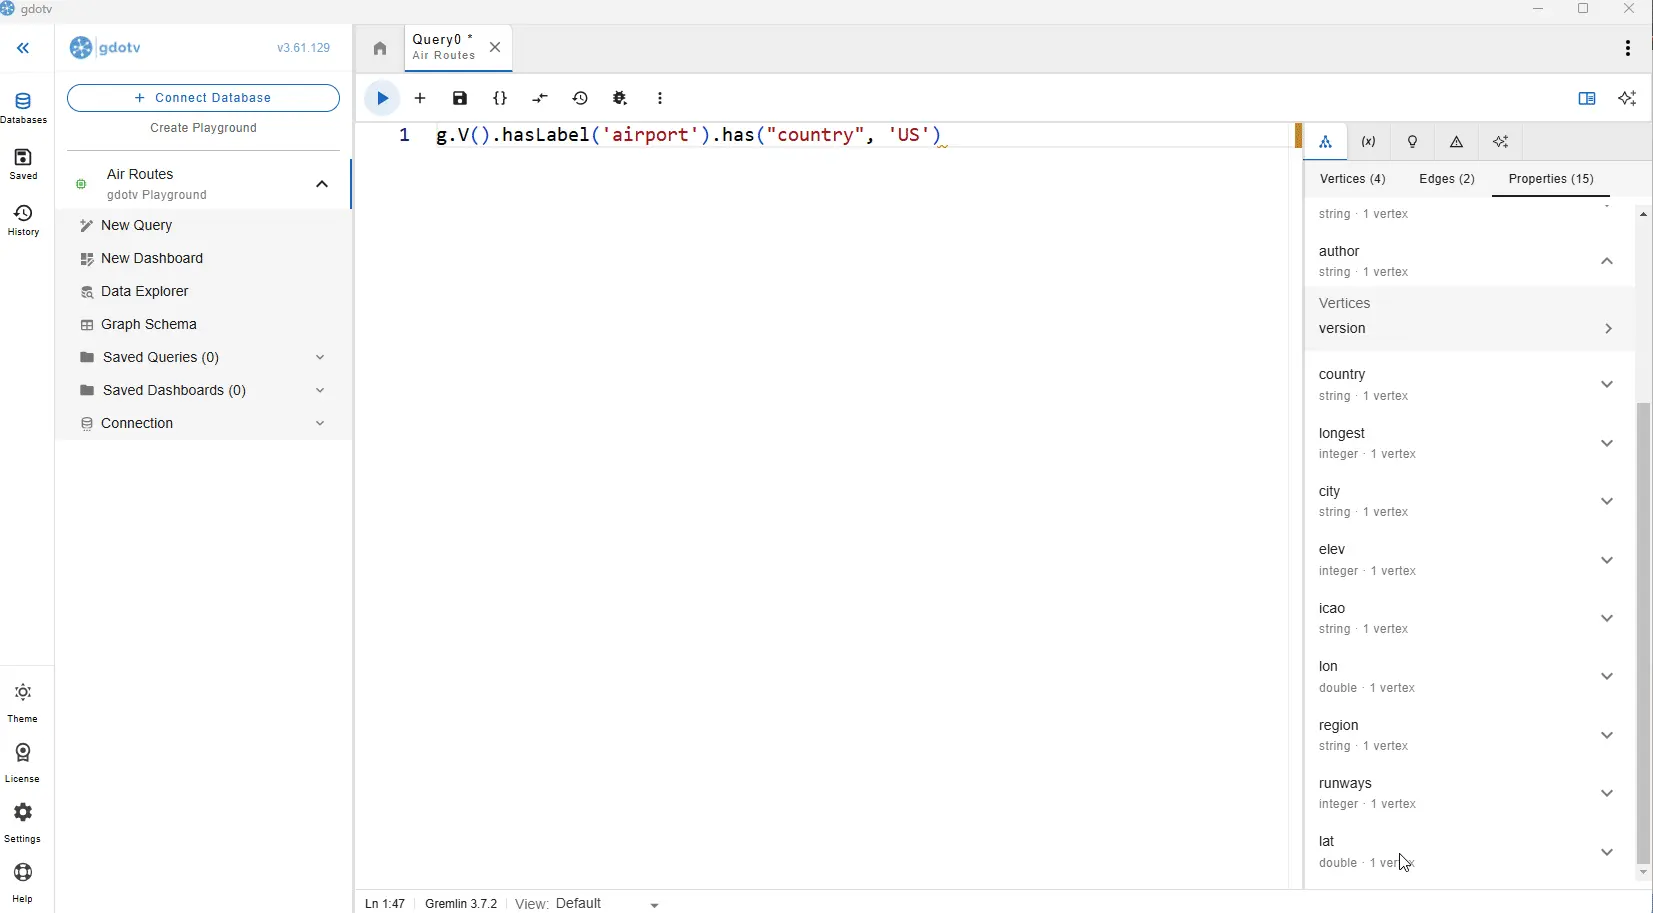
In gdotv, you can get the same result from the same query, but gdotv’s purpose-built query editor comes with a bunch of extra goodies to make writing easier. It has inbuilt documentation, autocomplete suggestions drawn from your graph schema, syntax highlighting to help you assemble your search, and added Cypher and SPARQL functionality.
Gdotv puts querying front and center:
Graph Visualization
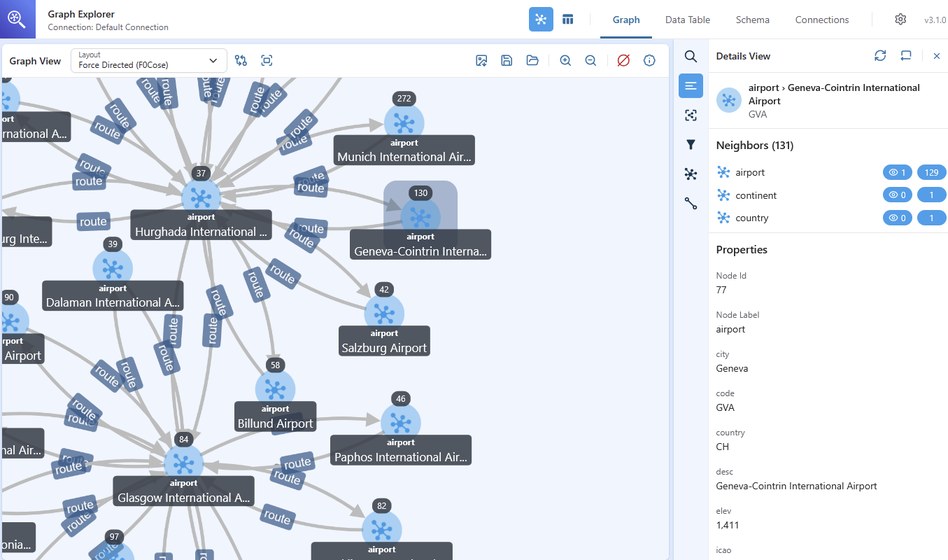
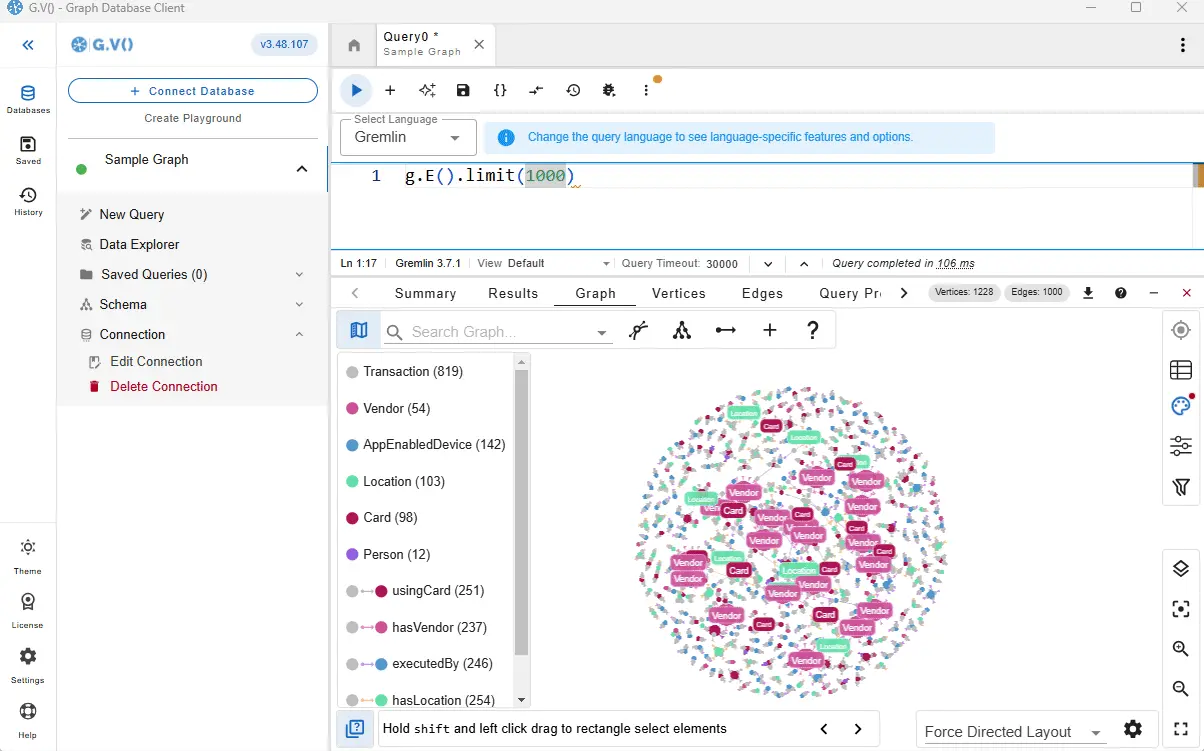
Both tools offer graph visualization, but with different depths. Graph Explorer has a decent range of layouts options and lets you customize styling, export views as high-resolution PNG images, and download data as CSV or JSON. Its clean, intuitive visual interface is a big plus for non-technical users, and the styling options for nodes and edges are very straightforward to set up. All the vital information is clearly visible, which is the most important thing, but it comes with the trade-off of being fairly minimal.
In gdotv, there are many layouts and more customization options, with advanced features such as custom node sizing based on degree or attributes, and custom label templates combining property values with free text. There’s even an ‘Apply Suggested Labels’ button that quickly applies what it works out to be the most meaningful label to each of the elements in your graph. You’re not limited to one style either, as you can save and seamlessly switch between multiple stylesheets.
Data Model & Schema
When working with graph databases, understanding your data model is essential. Navigating data becomes so much easier with a clear picture of your graph’s vertex and edge labels and their properties.
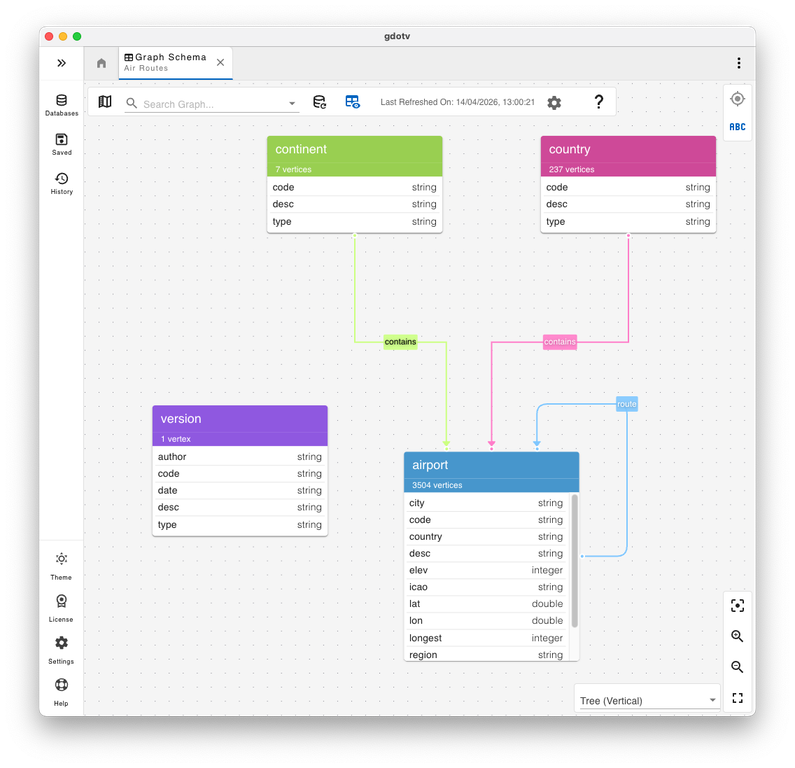
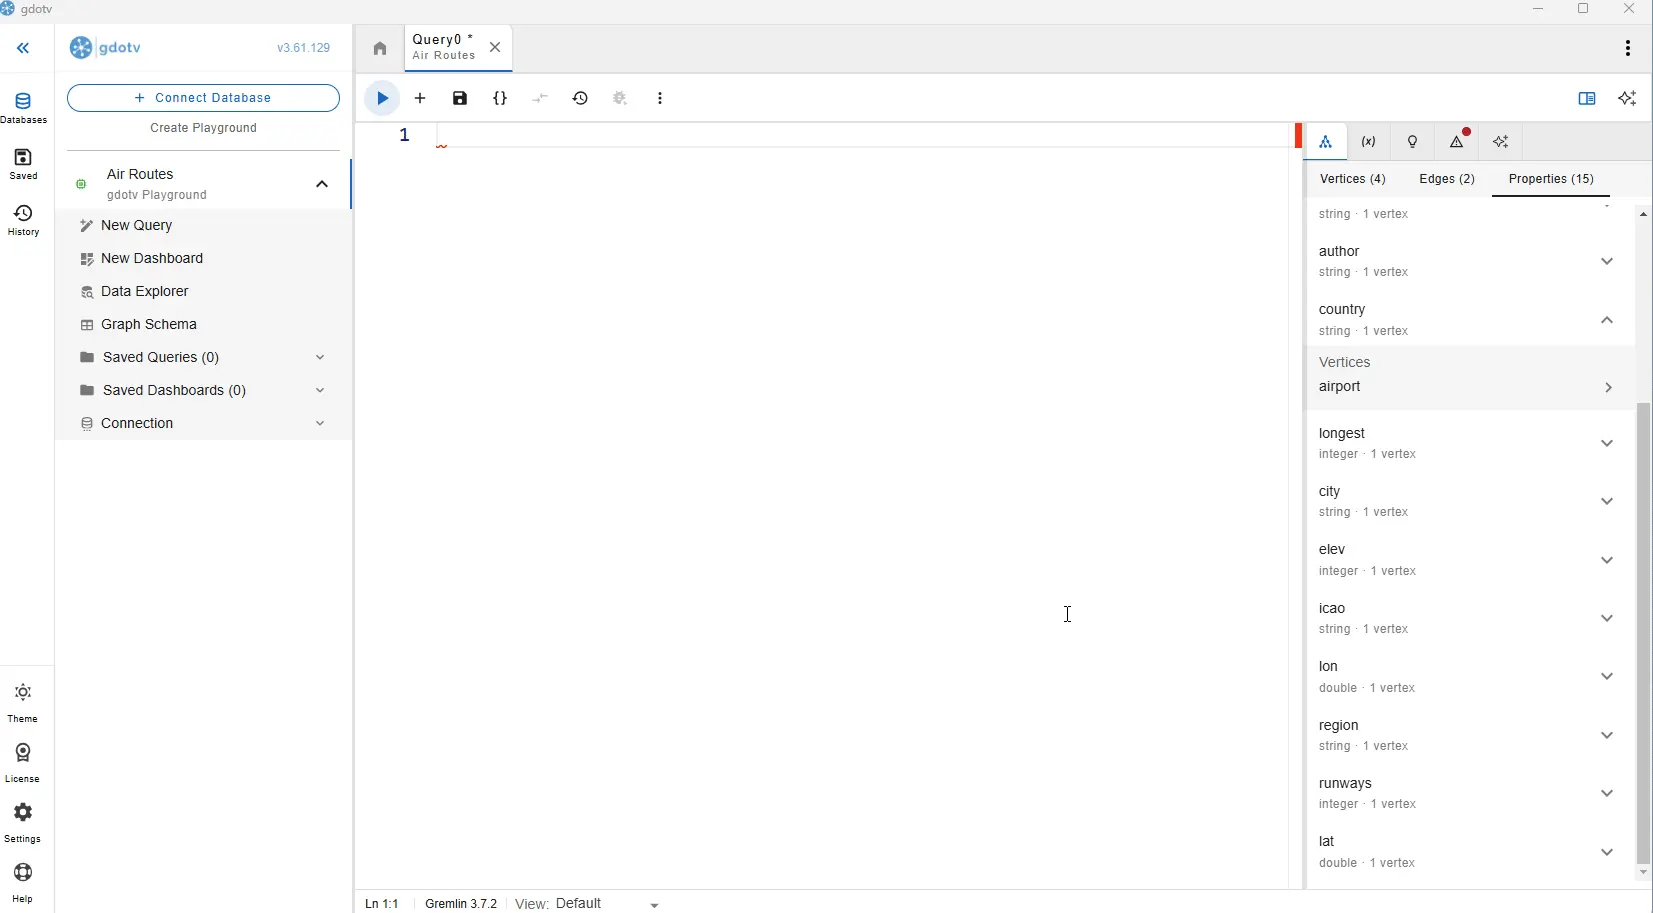
Gdotv addresses this directly with its Graph Schema view, which automatically infers your schema from the database itself and presents it as a slick entity-relationship diagram that’s always just one or two clicks away. There’s even a version of it in the Reference Panel which reacts as you’re typing a query, and autocomplete suggestions in the query editor are scheme-aware. No user setup is required, and the instant visibility is extremely helpful.
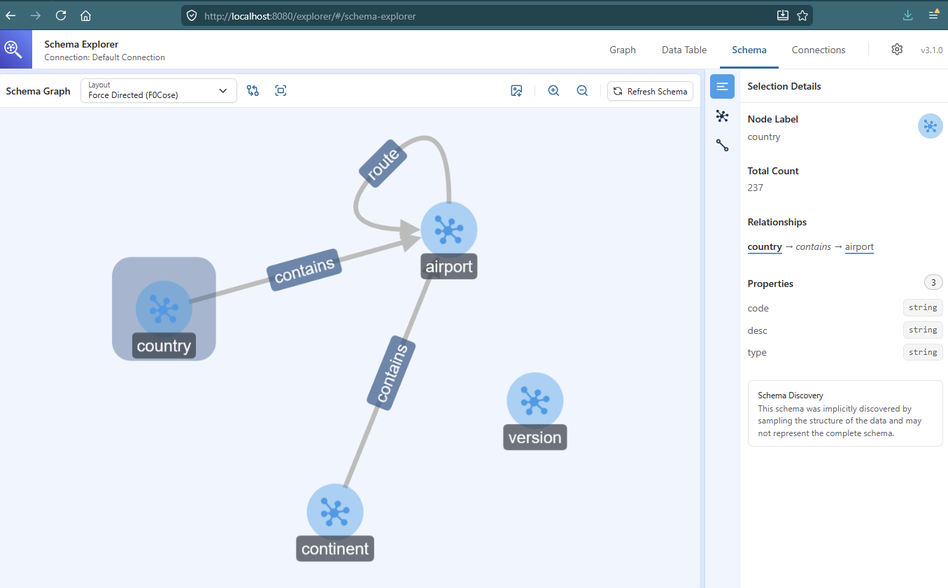
AWS Graph Explorer also offers its own schema view, from which you can click on individual nodes to display their properties. This schema view itself is very similar between applications, and your preference for which visualization you prefer may just come down to taste. However, with only a limited query editor, AWS Graph Explorer cannot leverage the schema as part of the graph exploration itself in the same way.
Neptune-Specific Integrations
For Neptune users specifically, gdotv has a number of additional benefits worth mentioning. IAM authentication is handled natively, which makes connecting securely to your database a lot simpler. Query profiling and explain plans, which would normally need to be constructed manually, are available instantly after running a query. This can be a significant time-saver for diagnosing slow or inefficient traversals. On top of that, gdotv integrates with AWS CloudWatch to pull in your Neptune slow query and audit logs. This lets you search, filter, and inspect queries that have been run against your endpoint, and re-run or profile them directly from the same interface.
Data Editing & Management
Graph Explorer is built purely for browsing and visualizing your data, so it makes sense for it to not include a way to modify it. You can view the properties of particular nodes and edges, but they are static and unchangeable by design.This makes AWS Graph Explorer strictly an observer to your graph, inherently separate and unintrusive to your graph data.
gdotv is designed to be an active development environment that communicates back-and-forth with your graph. With appropriate permissions, you can create, update, or delete vertices, edges, and properties all inside the application on the fly. All of this can be done both via mutation queries, or point-and-click editing on the graph display, making gdotv a more versatile tool for those who want a hands-on relationship with their data.
No-code Exploration / Dashboards
Gdotv includes its own no-code exploration with its Data Explorer feature. It lets you define path patterns, filter by label, direction, and property values, all without writing a query, essentially covering the same ground as Graph Explorer’s core use case, but within a tool that also does everything else.
The gdotv data explorer can also be used to search and filter across dynamic paths with a number of different node and edge types:
AWS Graph Explorer does not have a similar feature. You can search against all string properties for basic exploration, but this has its limitations. For example, you are not able to filter against numeric properties, and you cannot filter against edges..
Who Should Use What? (The Honest Take)
Graph Explorer is a good fit for non-technical users who need to browse and explore graph data without writing queries. This covers analysts, stakeholders, or anyone who just needs a visual window into the data. It’s free, open-source, and if your team already has the infrastructure to host it, the cost case is straightforward.
gdotv is the right choice for developers and data professionals who need a complete, day-to-day working environment for their graph database. It’s a paid product, but for anyone spending meaningful time working with a graph database, the productivity gains may well justify the cost. There’s also a three-week free trial, so you can see for yourself before committing.
Conclusion
These two tools aren’t really competing for the same user. Graph Explorer does its job well for what it is: a free, self-hosted visual exploration tool for non-technical audiences. But if you’re a developer doing complex work with a graph database, it will quickly show its limits. gdotv is purpose-built for that use case, and covers everything from querying and debugging to schema management and data editing under one roof.
The good news is that you can try both for free. Check out the AWS Graph Explorer o try the free trial of gdotv and see which works better for you.


